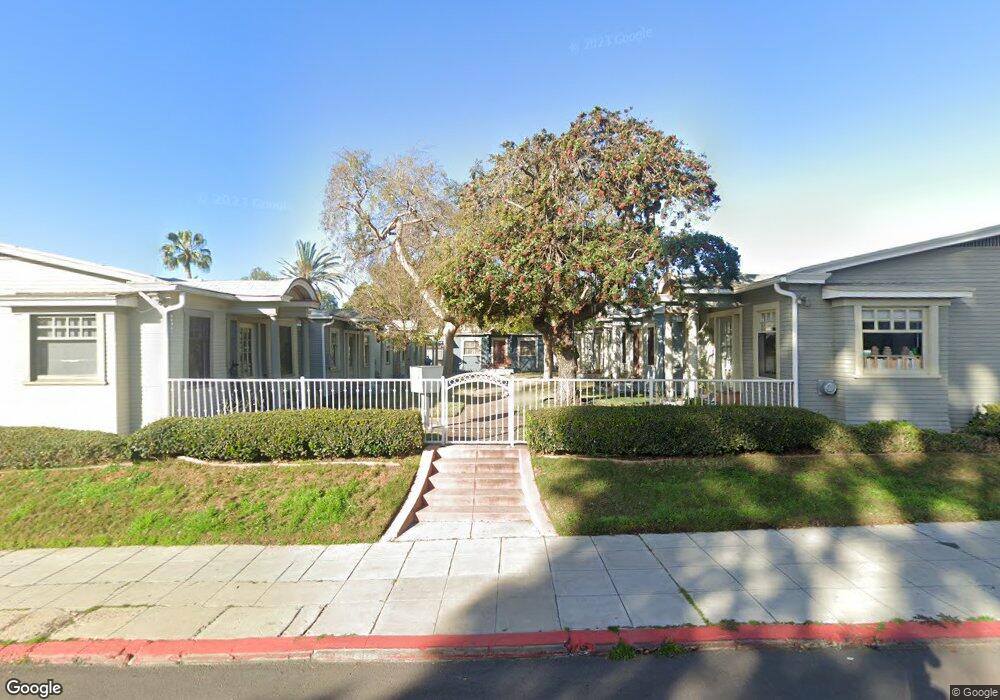
3218 30th St Unit U2 San Diego, CA 92104
North Park NeighborhoodEstimated Value: $445,833 - $681,000
1
Bed
1
Bath
494
Sq Ft
$1,134/Sq Ft
Est. Value
About This Home
This home is located at 3218 30th St Unit U2, San Diego, CA 92104 and is currently estimated at $560,208, approximately $1,134 per square foot. 3218 30th St Unit U2 is a home located in San Diego County with nearby schools including Jefferson Elementary, Roosevelt International Middle School, and Mcgill School Of Success.
Ownership History
Date
Name
Owned For
Owner Type
Purchase Details
Closed on
Sep 5, 2013
Sold by
Hellin Philippe
Bought by
Grander Raymond Lowell
Current Estimated Value
Purchase Details
Closed on
Jun 4, 2008
Sold by
Colonial Court Llc
Bought by
Hellin Phillipe
Home Financials for this Owner
Home Financials are based on the most recent Mortgage that was taken out on this home.
Original Mortgage
$208,000
Interest Rate
6.05%
Mortgage Type
Unknown
Create a Home Valuation Report for This Property
The Home Valuation Report is an in-depth analysis detailing your home's value as well as a comparison with similar homes in the area
Home Values in the Area
Average Home Value in this Area
Purchase History
| Date | Buyer | Sale Price | Title Company |
|---|---|---|---|
| Grander Raymond Lowell | $250,000 | Lawyers Title | |
| Hellin Phillipe | $260,000 | First American Title Company |
Source: Public Records
Mortgage History
| Date | Status | Borrower | Loan Amount |
|---|---|---|---|
| Previous Owner | Hellin Phillipe | $208,000 |
Source: Public Records
Tax History Compared to Growth
Tax History
| Year | Tax Paid | Tax Assessment Tax Assessment Total Assessment is a certain percentage of the fair market value that is determined by local assessors to be the total taxable value of land and additions on the property. | Land | Improvement |
|---|---|---|---|---|
| 2025 | $3,658 | $306,453 | $177,263 | $129,190 |
| 2024 | $3,658 | $300,445 | $173,788 | $126,657 |
| 2023 | $3,575 | $294,555 | $170,381 | $124,174 |
| 2022 | $3,478 | $288,781 | $167,041 | $121,740 |
| 2021 | $3,451 | $283,119 | $163,766 | $119,353 |
| 2020 | $3,409 | $280,217 | $162,087 | $118,130 |
| 2019 | $3,347 | $274,723 | $158,909 | $115,814 |
| 2018 | $3,129 | $269,338 | $155,794 | $113,544 |
| 2017 | $3,053 | $264,058 | $152,740 | $111,318 |
| 2016 | $3,002 | $258,882 | $149,746 | $109,136 |
| 2015 | $2,957 | $254,994 | $147,497 | $107,497 |
| 2014 | $2,910 | $250,000 | $144,608 | $105,392 |
Source: Public Records
Map
Nearby Homes