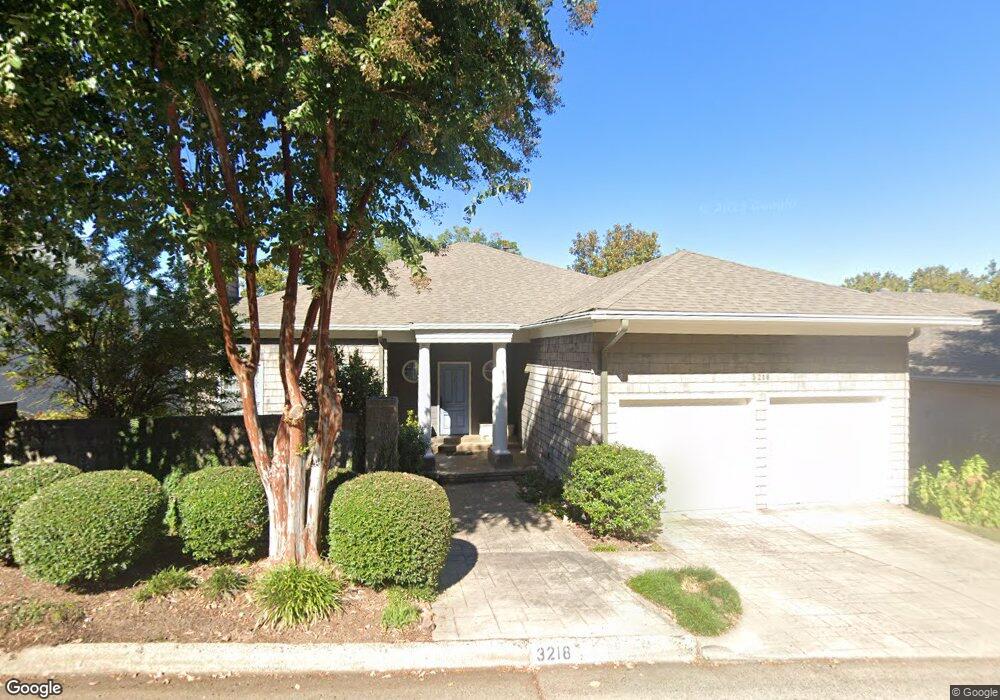
3218 Edgerstoune Ln Little Rock, AR 72205
Hillcrest NeighborhoodEstimated Value: $629,000 - $728,029
--
Bed
2
Baths
3,520
Sq Ft
$198/Sq Ft
Est. Value
About This Home
This home is located at 3218 Edgerstoune Ln, Little Rock, AR 72205 and is currently estimated at $697,007, approximately $198 per square foot. 3218 Edgerstoune Ln is a home located in Pulaski County with nearby schools including Pulaski Heights Elementary School, Pulaski Heights Middle School, and Central High School.
Ownership History
Date
Name
Owned For
Owner Type
Purchase Details
Closed on
Sep 6, 2014
Sold by
Die Sharon F and Die Sharon Foster
Bought by
Die Sharon F and Sharon F Die Revocable Trust
Current Estimated Value
Purchase Details
Closed on
Jun 15, 2006
Sold by
Die Sharon Foster and Bowman Sharon Foster
Bought by
Die Jerome G and Die Sharon Foster
Purchase Details
Closed on
Nov 17, 1998
Sold by
Bowman Sharon F
Bought by
Bowman Sharon Foster
Home Financials for this Owner
Home Financials are based on the most recent Mortgage that was taken out on this home.
Original Mortgage
$382,500
Interest Rate
6.91%
Mortgage Type
Purchase Money Mortgage
Purchase Details
Closed on
Sep 23, 1998
Sold by
Pryor David H and Pryor Barbara L
Bought by
Bowman Sharon F
Home Financials for this Owner
Home Financials are based on the most recent Mortgage that was taken out on this home.
Original Mortgage
$382,500
Interest Rate
6.91%
Mortgage Type
Purchase Money Mortgage
Create a Home Valuation Report for This Property
The Home Valuation Report is an in-depth analysis detailing your home's value as well as a comparison with similar homes in the area
Home Values in the Area
Average Home Value in this Area
Purchase History
| Date | Buyer | Sale Price | Title Company |
|---|---|---|---|
| Die Sharon F | -- | None Available | |
| Die Jerome G | $238,000 | None Available | |
| Bowman Sharon Foster | -- | Lenders Title Company | |
| Bowman Sharon F | $383,000 | Lenders Title Company |
Source: Public Records
Mortgage History
| Date | Status | Borrower | Loan Amount |
|---|---|---|---|
| Previous Owner | Bowman Sharon F | $382,500 |
Source: Public Records
Tax History Compared to Growth
Tax History
| Year | Tax Paid | Tax Assessment Tax Assessment Total Assessment is a certain percentage of the fair market value that is determined by local assessors to be the total taxable value of land and additions on the property. | Land | Improvement |
|---|---|---|---|---|
| 2025 | $4,993 | $129,893 | $22,194 | $107,699 |
| 2024 | $4,993 | $129,893 | $22,194 | $107,699 |
| 2023 | $4,993 | $129,893 | $22,194 | $107,699 |
| 2022 | $4,993 | $129,893 | $22,194 | $107,699 |
| 2021 | $5,029 | $83,740 | $22,190 | $61,550 |
| 2020 | $4,618 | $83,740 | $22,190 | $61,550 |
| 2019 | $4,618 | $83,740 | $22,190 | $61,550 |
| 2018 | $4,643 | $83,740 | $22,190 | $61,550 |
| 2017 | $4,643 | $83,740 | $22,190 | $61,550 |
| 2016 | $4,993 | $90,130 | $26,000 | $64,130 |
| 2015 | $5,001 | $71,334 | $26,000 | $45,334 |
| 2014 | $5,001 | $71,334 | $26,000 | $45,334 |
Source: Public Records
Map
Nearby Homes
- 921 Midland St
- 3409 Hill Rd
- 3612 Oakwood Rd
- 505 N Valentine St
- 621 N Pine St
- 3901 Cedar Hill Rd
- 518 N Oak St
- 516 N Oak St
- 3901 Cedar Hill #23 Rd
- 313 Charles St
- 3500 Cedar Hill Rd
- 1204 Kavanaugh Blvd
- 1109 Kavanaugh Blvd
- 301 N Woodrow St
- 1116 Kavanaugh Blvd
- 3700 Cantrell Road #1002
- 3700 Cantrell Rd
- 203 Midland St
- 206 Linwood Ct
- 111 Midland St
- 3214 Edgerstoune Ln
- 3220 Edgerstoune Ln
- 3220 Edgerstoune Ln
- 3210 Edgerstoune Ln
- 3206 Edgerstoune Ln Unit 1
- 1000 N Martin St
- 1000 N Martin # 2
- N Martin Unit Unit 1
- 910 N Martin St
- 1000 N Martin St
- 1000 N Martin St Unit 4
- 1000 N Martin St Unit 3
- 1000 N Martin St Unit 2
- 1000 N Martin St Unit 1
- 1000 N Martin St Unit 2 Street
- N Martin St
- 908 N Martin St
- 3202 Edgerstoune Ln
- 906 N Martin St
- 904 N Martin St