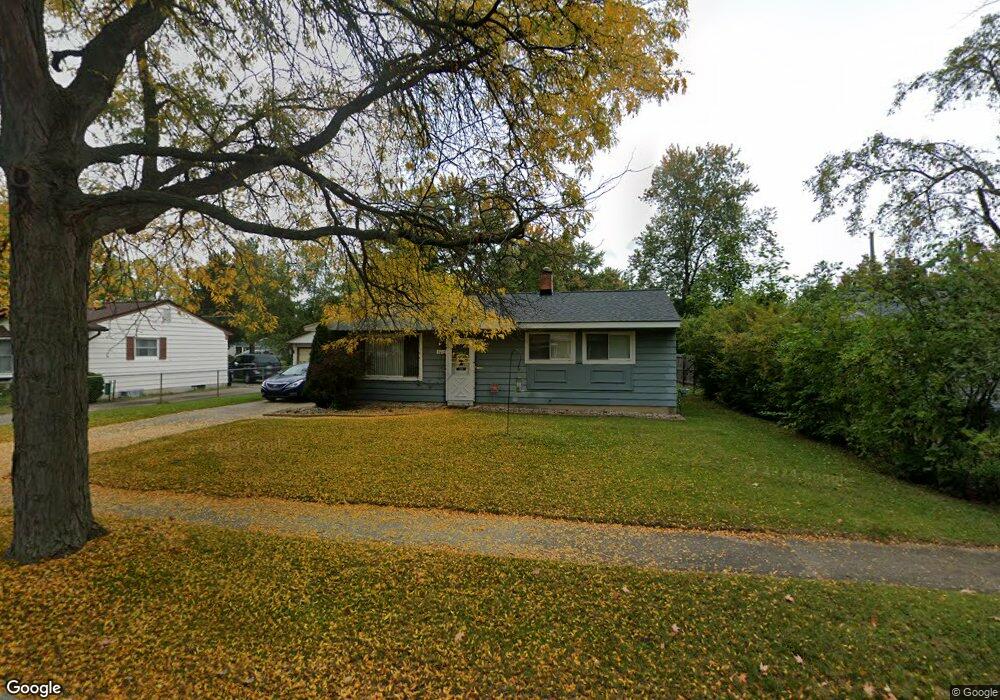
3218 Glenbrook Dr Lansing, MI 48911
Churchill Downs NeighborhoodEstimated Value: $98,000 - $150,000
Studio
--
Bath
912
Sq Ft
$147/Sq Ft
Est. Value
About This Home
This home is located at 3218 Glenbrook Dr, Lansing, MI 48911 and is currently estimated at $133,870, approximately $146 per square foot. 3218 Glenbrook Dr is a home located in Ingham County with nearby schools including Averill Elementary School, Attwood School, and J.W. Sexton High School.
Ownership History
Date
Name
Owned For
Owner Type
Purchase Details
Closed on
Dec 1, 2004
Sold by
Flintz Walter Kirk and Flintz Susan K
Bought by
The Walter Kirk & Susan K Flintz Revocab
Current Estimated Value
Purchase Details
Closed on
Aug 9, 2001
Sold by
Flintz June Elizabeth
Bought by
Flintz Walter Kirk
Purchase Details
Closed on
Jun 16, 1999
Sold by
Patrick Walter L and Patrick Rebecca D
Bought by
Flintz Walter K and Flintz June E
Home Financials for this Owner
Home Financials are based on the most recent Mortgage that was taken out on this home.
Original Mortgage
$76,973
Interest Rate
7.15%
Mortgage Type
FHA
Purchase Details
Closed on
Jun 7, 1996
Sold by
Bunnell Anthony J and Bunnell Ronda R
Bought by
Patrick Walter and Patrick Rebecca
Create a Home Valuation Report for This Property
The Home Valuation Report is an in-depth analysis detailing your home's value as well as a comparison with similar homes in the area
Home Values in the Area
Average Home Value in this Area
Purchase History
| Date | Buyer | Sale Price | Title Company |
|---|---|---|---|
| The Walter Kirk & Susan K Flintz Revocab | -- | -- | |
| Flintz Walter Kirk | -- | -- | |
| Flintz Walter K | $78,000 | First American Title Ins Co | |
| Patrick Walter | $60,000 | -- |
Source: Public Records
Mortgage History
| Date | Status | Borrower | Loan Amount |
|---|---|---|---|
| Previous Owner | Flintz Walter K | $76,973 |
Source: Public Records
Tax History
| Year | Tax Paid | Tax Assessment Tax Assessment Total Assessment is a certain percentage of the fair market value that is determined by local assessors to be the total taxable value of land and additions on the property. | Land | Improvement |
|---|---|---|---|---|
| 2025 | $2,140 | $54,500 | $8,600 | $45,900 |
| 2024 | $2,008 | $52,300 | $8,600 | $43,700 |
| 2023 | $422 | $47,200 | $8,600 | $38,600 |
| 2022 | $405 | $41,000 | $8,600 | $32,400 |
| 2021 | $1,776 | $37,700 | $6,400 | $31,300 |
| 2020 | $1,764 | $35,000 | $6,400 | $28,600 |
| 2019 | $1,690 | $34,000 | $6,400 | $27,600 |
| 2018 | $1,585 | $29,200 | $6,400 | $22,800 |
| 2017 | $1,517 | $29,200 | $6,400 | $22,800 |
| 2016 | $1,478 | $26,300 | $6,400 | $19,900 |
| 2015 | $1,478 | $25,600 | $12,896 | $12,704 |
| 2014 | $1,478 | $25,700 | $20,060 | $5,640 |
Source: Public Records
Map
Nearby Homes
- 3100 Glenbrook Dr
- 3401 S Deerfield Ave
- 3230 S Deerfield Ave
- 0 S Deerfield Ave
- 3721 Kendalwood Dr
- 3112 Shetland Rd
- 3924 Wedgewood Dr
- 3907 Ingham St
- 4209 Brighton Dr
- 4416 Ballard Rd
- 3618 Malibu Dr
- 3945 Windward Dr
- 3946 Hunters Ridge Dr Unit 2
- 2105 Mary Ave
- 2101 Mary Ave
- 2409 Victor Ave
- 4400 Chadburne Dr
- 3214 Raynell St
- 2924 Woodview Dr
- 1904 Hillcrest St
- 3212 Glenbrook Dr
- 3224 Glenbrook Dr
- 3500 Wainwright Ave
- 3202 Glenbrook Dr
- 3418 Wainwright Ave
- 3501 Churchill Ave
- 3513 Churchill Ave
- 3507 Churchill Ave
- 3219 Glenbrook Dr
- 3225 Glenbrook Dr
- 3213 Glenbrook Dr
- 3412 Wainwright Ave
- 3201 Glenbrook Dr
- 3419 Churchill Ave
- 3601 Churchill Ave
- 3406 Wainwright Ave
- 3610 Wainwright Ave
- 3607 Churchill Ave
- 3507 Wainwright Ave
- 3114 Glenbrook Dr
Your Personal Tour Guide
Ask me questions while you tour the home.