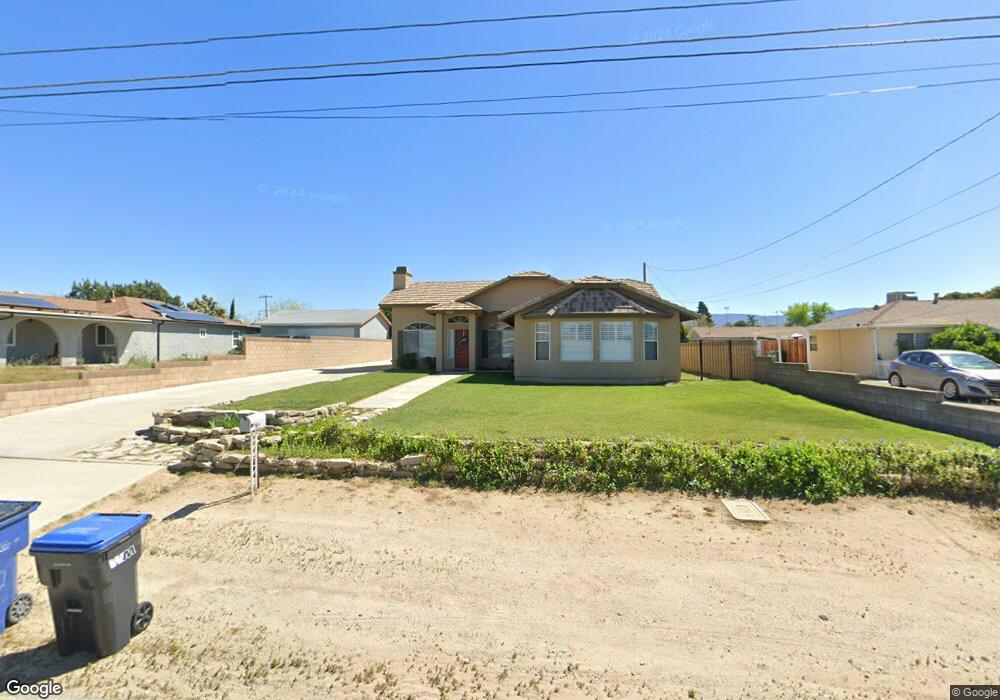
3218 W Avenue l6 Lancaster, CA 93536
West Lancaster NeighborhoodEstimated Value: $480,000 - $600,000
3
Beds
2
Baths
1,949
Sq Ft
$274/Sq Ft
Est. Value
About This Home
This home is located at 3218 W Avenue l6, Lancaster, CA 93536 and is currently estimated at $533,234, approximately $273 per square foot. 3218 W Avenue l6 is a home located in Los Angeles County with nearby schools including Valley View Elementary School, Joe Walker Middle School, and Lancaster High School.
Ownership History
Date
Name
Owned For
Owner Type
Purchase Details
Closed on
Sep 10, 2013
Sold by
Ritter Gregory J
Bought by
Ritter Gregory J
Current Estimated Value
Home Financials for this Owner
Home Financials are based on the most recent Mortgage that was taken out on this home.
Original Mortgage
$179,500
Outstanding Balance
$133,736
Interest Rate
4.36%
Mortgage Type
New Conventional
Estimated Equity
$399,498
Purchase Details
Closed on
Jul 23, 2002
Sold by
Rockland Pacific Financial Inc
Bought by
Ritter Gregory J
Home Financials for this Owner
Home Financials are based on the most recent Mortgage that was taken out on this home.
Original Mortgage
$168,000
Interest Rate
6.52%
Purchase Details
Closed on
May 23, 2002
Sold by
Turner Deborah E and Deborah E Turner Living Trust
Bought by
Rockland Pacific Financial Inc
Purchase Details
Closed on
Jan 11, 1995
Sold by
Turner Deborah
Bought by
Turner Deborah E and The Deborah E Turner Living Trust
Create a Home Valuation Report for This Property
The Home Valuation Report is an in-depth analysis detailing your home's value as well as a comparison with similar homes in the area
Home Values in the Area
Average Home Value in this Area
Purchase History
| Date | Buyer | Sale Price | Title Company |
|---|---|---|---|
| Ritter Gregory J | -- | First American Title Co La | |
| Ritter Gregory J | $210,000 | First American Title Co | |
| Rockland Pacific Financial Inc | -- | Fidelity Title | |
| Turner Deborah E | -- | -- |
Source: Public Records
Mortgage History
| Date | Status | Borrower | Loan Amount |
|---|---|---|---|
| Open | Ritter Gregory J | $179,500 | |
| Closed | Ritter Gregory J | $168,000 |
Source: Public Records
Tax History Compared to Growth
Tax History
| Year | Tax Paid | Tax Assessment Tax Assessment Total Assessment is a certain percentage of the fair market value that is determined by local assessors to be the total taxable value of land and additions on the property. | Land | Improvement |
|---|---|---|---|---|
| 2025 | $4,960 | $304,122 | $85,146 | $218,976 |
| 2024 | $4,960 | $298,160 | $83,477 | $214,683 |
| 2023 | $4,907 | $292,315 | $81,841 | $210,474 |
| 2022 | $4,693 | $286,585 | $80,237 | $206,348 |
| 2021 | $4,278 | $280,966 | $78,664 | $202,302 |
| 2019 | $4,166 | $272,634 | $76,332 | $196,302 |
| 2018 | $4,111 | $267,289 | $74,836 | $192,453 |
| 2016 | $3,892 | $256,912 | $71,931 | $184,981 |
| 2015 | $3,833 | $252,000 | $70,500 | $181,500 |
| 2014 | $3,789 | $244,700 | $68,500 | $176,200 |
Source: Public Records
Map
Nearby Homes
- 3330 W Avenue l4
- 42626 32nd St W
- 42545 30th St W
- 30 W Cor 30th Stw Ave Unit L8
- 0 W Avenue l10 Unit 25006351
- W Avenue L-8
- 3224 W Avenue L
- 42719 30th St W
- 3340 Brittany Ln
- 3143 Peachwood Dr
- 3137 Peachwood Dr
- 0 Ave L8 Pav Vic 37th Stw Unit 25007155
- 42662 28th St W
- 2706 W Avenue l4
- 0 L4 39th Vac Vic Ave Unit 24008020
- 3122 Softwood Ct
- 42926 Pearlwood Dr
- 42803 Alexo Dr
- 42935 Lemonwood Dr
- 3319 Camino Hermanos
- 3210 W Avenue l6
- 3224 W Avenue l6 Unit B
- 3224 W Avenue l6
- 3230 W Avenue l6
- 42451 32nd St W
- 3219 W Avenue l6
- 3238 W Avenue l6
- 42435 32nd St W
- 3225 W Avenue l6
- 3233 W Avenue l6
- 42505 32nd St W
- 0 W Cor 32th Stw Ave Unit L6 16010731
- 3246 W Avenue l6
- 42427 32nd St W
- 3239 W Avenue l6
- 3239 W Avenue L 6
- 42440 32nd St W
- 3245 W Avenue l6
- 3152 W Avenue l6
- 3252 W Avenue l6