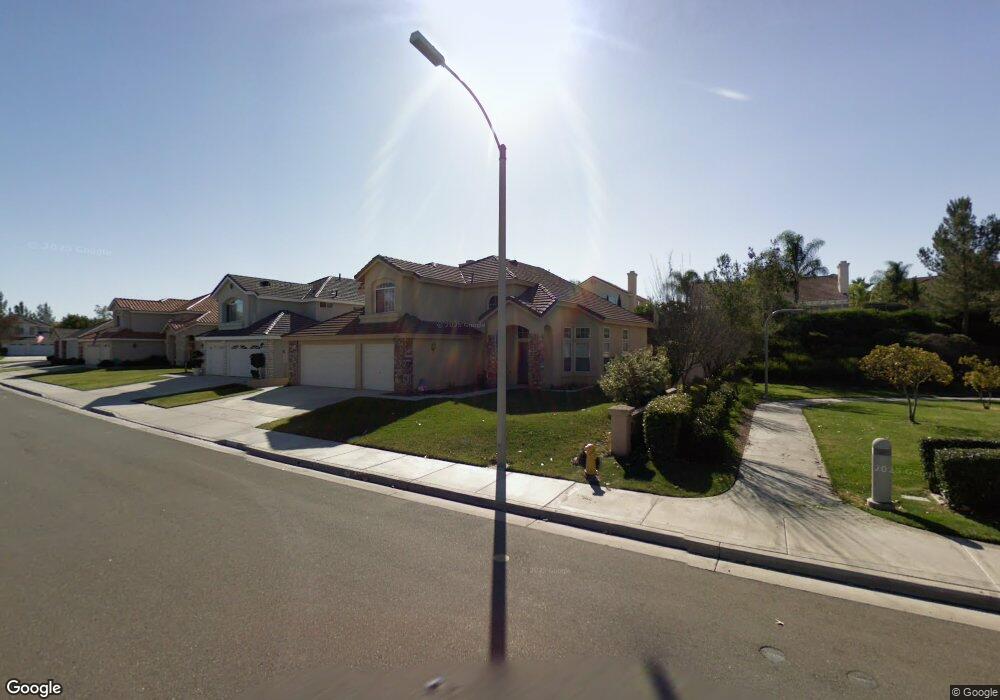
32191 Via Bande Temecula, CA 92592
Paloma del Sol NeighborhoodEstimated Value: $751,172 - $792,000
4
Beds
3
Baths
2,205
Sq Ft
$350/Sq Ft
Est. Value
About This Home
This home is located at 32191 Via Bande, Temecula, CA 92592 and is currently estimated at $772,293, approximately $350 per square foot. 32191 Via Bande is a home located in Riverside County with nearby schools including Paloma Elementary School, Temecula Middle School, and Temecula Valley High School.
Ownership History
Date
Name
Owned For
Owner Type
Purchase Details
Closed on
Sep 23, 2021
Sold by
Smith Thomas C and Smith Kari K
Bought by
Smith Thomas C and Smith Kari K
Current Estimated Value
Purchase Details
Closed on
Jan 31, 2011
Sold by
Smith Kari K
Bought by
Smith Thomas C
Home Financials for this Owner
Home Financials are based on the most recent Mortgage that was taken out on this home.
Original Mortgage
$419,250
Outstanding Balance
$254,246
Interest Rate
2.51%
Mortgage Type
Reverse Mortgage Home Equity Conversion Mortgage
Estimated Equity
$518,047
Purchase Details
Closed on
May 10, 1996
Sold by
Richmond American Homes Of Ca Inc
Bought by
Smith Thomas C and Smith Kari K
Home Financials for this Owner
Home Financials are based on the most recent Mortgage that was taken out on this home.
Original Mortgage
$102,000
Interest Rate
8.03%
Mortgage Type
Purchase Money Mortgage
Create a Home Valuation Report for This Property
The Home Valuation Report is an in-depth analysis detailing your home's value as well as a comparison with similar homes in the area
Home Values in the Area
Average Home Value in this Area
Purchase History
| Date | Buyer | Sale Price | Title Company |
|---|---|---|---|
| Smith Thomas C | -- | None Available | |
| Smith Thomas C | -- | None Available | |
| Smith Thomas C | -- | Lawyers Title | |
| Smith Thomas C | $163,500 | First American Title Ins Co |
Source: Public Records
Mortgage History
| Date | Status | Borrower | Loan Amount |
|---|---|---|---|
| Open | Smith Thomas C | $419,250 | |
| Previous Owner | Smith Thomas C | $102,000 |
Source: Public Records
Tax History
| Year | Tax Paid | Tax Assessment Tax Assessment Total Assessment is a certain percentage of the fair market value that is determined by local assessors to be the total taxable value of land and additions on the property. | Land | Improvement |
|---|---|---|---|---|
| 2025 | $3,330 | $265,438 | $56,982 | $208,456 |
| 2023 | $3,330 | $255,132 | $54,770 | $200,362 |
| 2022 | $3,221 | $250,131 | $53,697 | $196,434 |
| 2021 | $3,149 | $245,228 | $52,645 | $192,583 |
| 2020 | $3,113 | $242,715 | $52,106 | $190,609 |
| 2019 | $3,066 | $237,957 | $51,085 | $186,872 |
| 2018 | $3,002 | $233,292 | $50,084 | $183,208 |
| 2017 | $2,947 | $228,718 | $49,102 | $179,616 |
| 2016 | $2,892 | $224,235 | $48,140 | $176,095 |
| 2015 | $2,839 | $220,868 | $47,418 | $173,450 |
| 2014 | $2,751 | $216,543 | $46,490 | $170,053 |
Source: Public Records
Map
Nearby Homes
- 43186 Corte Argento
- 31989 Corte Cardoza
- 43425 Corte Logrono
- 31954 Calle Ballentine
- 43993 Barletta St
- 0 De Portola Unit SW25275250
- 0 De Portola Unit SW25275215
- 32274 Corte Illora
- 43898 Carentan Dr
- 43750 Corte Amaya
- 44011 Rivo Ct
- 31850 Via Barraza
- 44049 Terraza Ct
- 42898 Calle Londe
- 44006 Terraza Ct
- 43922 Sassari St
- 32865 Naples Ct
- 32163 Cala Torrente
- 32179 Cala Torrente
- 31648 Corte Esparza
- 32205 Via Bande
- 32198 Via Cordaro
- 32184 Via Cordaro
- 32159 Via Bande
- 32219 Via Bande
- 32212 Via Cordaro
- 32194 Via Bande
- 32145 Via Bande
- 43395 Corte Durazo
- 32208 Via Bande
- 32233 Via Bande
- 32166 Via Bande
- 32226 Via Cordaro
- 32222 Via Bande
- 32152 Via Bande
- 32131 Via Bande
- 43409 Corte Durazo
- 32236 Via Bande
- 32138 Via Bande
- 43378 Calle Carabana
Your Personal Tour Guide
Ask me questions while you tour the home.