Estimated Value: $1,962,000 - $2,436,000
4
Beds
5
Baths
2,885
Sq Ft
$767/Sq Ft
Est. Value
About This Home
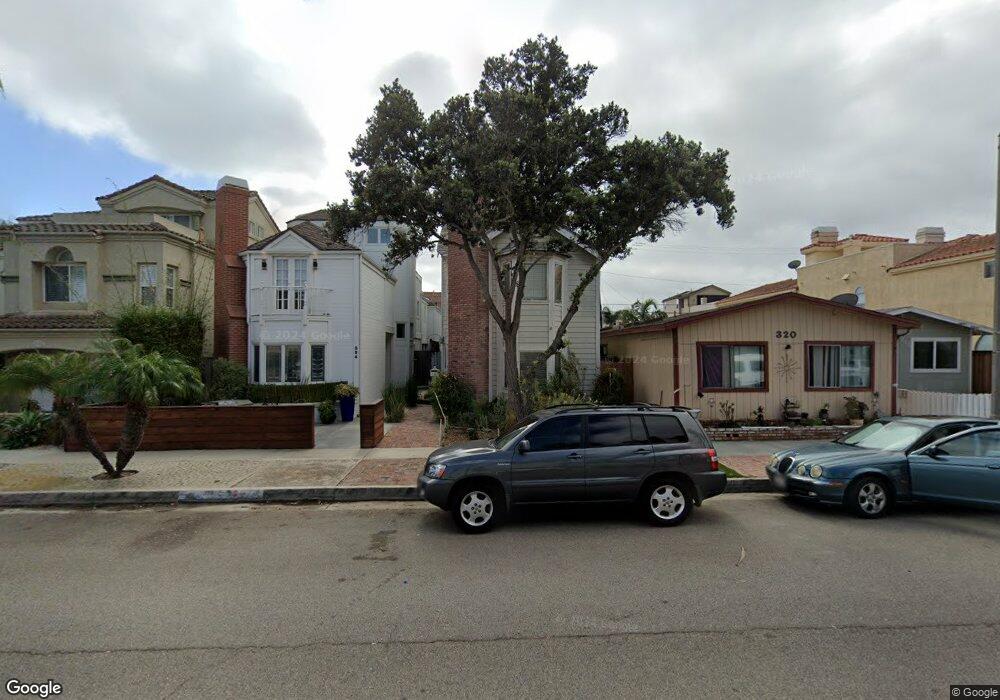
This home is located at 322 14th St, Huntington Beach, CA 92648 and is currently estimated at $2,212,354, approximately $766 per square foot. 322 14th St is a home located in Orange County with nearby schools including Agnes L. Smith Elementary, Ethel Dwyer Middle, and Huntington Beach High School.
Ownership History
Date
Name
Owned For
Owner Type
Purchase Details
Closed on
Dec 14, 1999
Sold by
Richard Rector and Richard David Vento
Bought by
Thompson Michael and Thompson Debra
Current Estimated Value
Home Financials for this Owner
Home Financials are based on the most recent Mortgage that was taken out on this home.
Original Mortgage
$393,600
Interest Rate
8.26%
Mortgage Type
Stand Alone First
Purchase Details
Closed on
Jun 26, 1998
Sold by
Vento David
Bought by
Rector Richard Christopher and Vento David
Purchase Details
Closed on
Jun 18, 1998
Sold by
Rector Richard Christopher
Bought by
Vento David
Purchase Details
Closed on
Feb 5, 1997
Sold by
Rochelle Dawn
Bought by
Rochelle Larry
Purchase Details
Closed on
Jan 1, 1997
Sold by
Rochelle Andronaco J
Bought by
Rector Richard Christopher and Vento David
Purchase Details
Closed on
May 26, 1994
Sold by
Trout Charles
Bought by
Trout Charles and Rochelle Larry
Create a Home Valuation Report for This Property
The Home Valuation Report is an in-depth analysis detailing your home's value as well as a comparison with similar homes in the area
Home Values in the Area
Average Home Value in this Area
Purchase History
| Date | Buyer | Sale Price | Title Company |
|---|---|---|---|
| Thompson Michael | $485,000 | -- | |
| Rector Richard Christopher | -- | First Southwestern Title Co | |
| Vento David | -- | -- | |
| Rochelle Larry | -- | Southland Title Corporation | |
| Rector Richard Christopher | -- | Southland Title Corporation | |
| Trout Charles | -- | Southland Title Corporation | |
| Trout Charles | -- | North American Title |
Source: Public Records
Mortgage History
| Date | Status | Borrower | Loan Amount |
|---|---|---|---|
| Previous Owner | Thompson Michael | $393,600 |
Source: Public Records
Tax History Compared to Growth
Tax History
| Year | Tax Paid | Tax Assessment Tax Assessment Total Assessment is a certain percentage of the fair market value that is determined by local assessors to be the total taxable value of land and additions on the property. | Land | Improvement |
|---|---|---|---|---|
| 2025 | $8,489 | $756,186 | $414,565 | $341,621 |
| 2024 | $8,489 | $741,359 | $406,436 | $334,923 |
| 2023 | $8,298 | $726,823 | $398,467 | $328,356 |
| 2022 | $8,079 | $712,572 | $390,654 | $321,918 |
| 2021 | $7,928 | $698,600 | $382,994 | $315,606 |
| 2020 | $7,876 | $691,437 | $379,067 | $312,370 |
| 2019 | $7,781 | $677,880 | $371,634 | $306,246 |
| 2018 | $7,660 | $664,589 | $364,347 | $300,242 |
| 2017 | $7,557 | $651,558 | $357,203 | $294,355 |
| 2016 | $7,221 | $638,783 | $350,199 | $288,584 |
| 2015 | $7,151 | $629,188 | $344,938 | $284,250 |
| 2014 | $7,000 | $616,864 | $338,182 | $278,682 |
Source: Public Records
Map
Nearby Homes
- 319 14th St Unit B
- 413 14th St Unit D
- 416 15th St
- 228 12th St Unit 1113 Olive Av
- 1111 Olive Ave Unit A & B
- 323 11th St
- 521 12th St
- 1200 Pacific Coast Hwy Unit 102
- 1200 Pacific Coast Hwy
- 1200 Pacific Coast Hwy Unit 214
- 526 12th St
- 221 10th St
- 1400 Pacific Coast Hwy Unit 305
- 427 10th St
- 306 17th St
- 613 13th St
- 116 11th St
- 1516 Pacific Coast Hwy Unit 101
- 1102 Pacific Coast Hwy Unit Lot 4
- 125 16th St