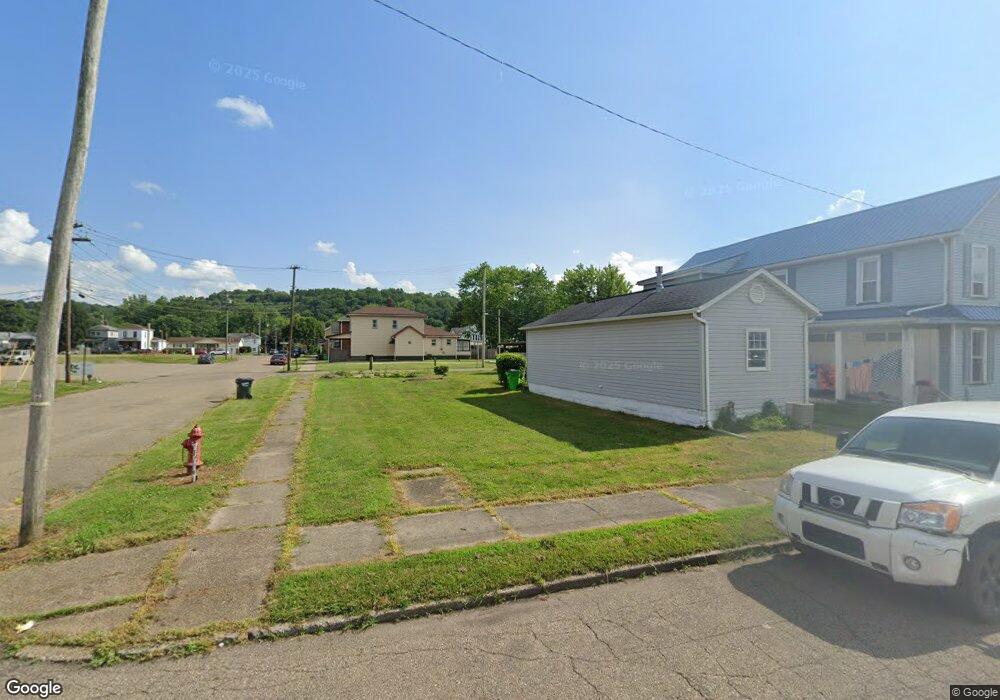
322 Bank St Dennison, OH 44621
Estimated Value: $212,000 - $324,601
4
Beds
1
Bath
1,792
Sq Ft
$142/Sq Ft
Est. Value
About This Home
This home is located at 322 Bank St, Dennison, OH 44621 and is currently estimated at $253,867, approximately $141 per square foot. 322 Bank St is a home located in Tuscarawas County with nearby schools including Claymont High School and Immaculate Conception School.
Ownership History
Date
Name
Owned For
Owner Type
Purchase Details
Closed on
Feb 21, 2020
Sold by
Village Of Dennison
Bought by
Tusco Grocers Inc
Current Estimated Value
Purchase Details
Closed on
Nov 21, 2019
Sold by
Weaver Tracy L Howell
Bought by
Village Of Dennison
Purchase Details
Closed on
Apr 24, 1995
Sold by
Patterson Virginia
Bought by
Howell Tracey L
Home Financials for this Owner
Home Financials are based on the most recent Mortgage that was taken out on this home.
Original Mortgage
$36,000
Interest Rate
8.64%
Mortgage Type
New Conventional
Create a Home Valuation Report for This Property
The Home Valuation Report is an in-depth analysis detailing your home's value as well as a comparison with similar homes in the area
Home Values in the Area
Average Home Value in this Area
Purchase History
| Date | Buyer | Sale Price | Title Company |
|---|---|---|---|
| Tusco Grocers Inc | $202,500 | Connolly Hillyer & Welch Ttl | |
| Village Of Dennison | $17,660 | None Available | |
| Howell Tracey L | $36,000 | -- |
Source: Public Records
Mortgage History
| Date | Status | Borrower | Loan Amount |
|---|---|---|---|
| Previous Owner | Howell Tracey L | $36,000 |
Source: Public Records
Tax History Compared to Growth
Tax History
| Year | Tax Paid | Tax Assessment Tax Assessment Total Assessment is a certain percentage of the fair market value that is determined by local assessors to be the total taxable value of land and additions on the property. | Land | Improvement |
|---|---|---|---|---|
| 2024 | $99 | $2,600 | $1,910 | $690 |
| 2023 | $99 | $7,440 | $5,470 | $1,970 |
| 2022 | $103 | $2,604 | $1,915 | $690 |
| 2021 | $83 | $1,933 | $1,236 | $697 |
| 2020 | $6 | $1,933 | $1,236 | $697 |
| 2019 | $6 | $1,933 | $1,236 | $697 |
| 2018 | $533 | $12,520 | $1,040 | $11,480 |
| 2017 | $548 | $12,520 | $1,040 | $11,480 |
| 2016 | $544 | $12,520 | $1,040 | $11,480 |
| 2014 | $649 | $14,830 | $1,040 | $13,790 |
| 2013 | $655 | $14,830 | $1,040 | $13,790 |
Source: Public Records
Map
Nearby Homes