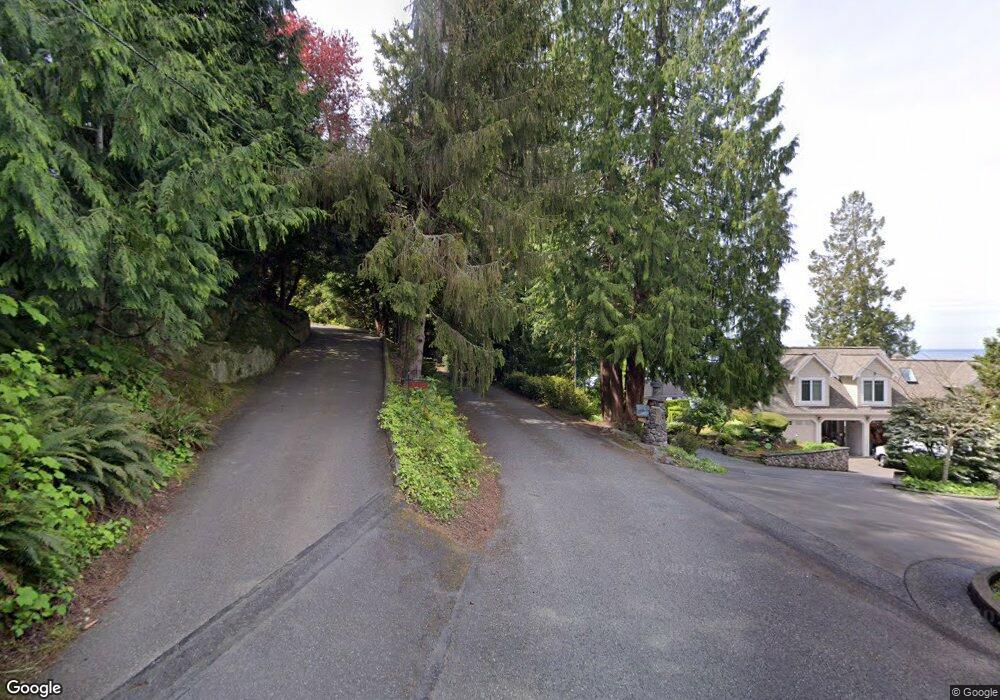
322 Chuckanut Point Rd Bellingham, WA 98229
Estimated Value: $1,420,000 - $6,539,269
2
Beds
1
Bath
1,482
Sq Ft
$2,967/Sq Ft
Est. Value
About This Home
This home is located at 322 Chuckanut Point Rd, Bellingham, WA 98229 and is currently estimated at $4,396,756, approximately $2,966 per square foot. 322 Chuckanut Point Rd is a home located in Whatcom County with nearby schools including Happy Valley Elementary School, Fairhaven Middle School, and Sehome High School.
Ownership History
Date
Name
Owned For
Owner Type
Purchase Details
Closed on
Mar 14, 2007
Sold by
Petty Daniel S
Bought by
Leenstra Kelly and Leenstra Koelle
Current Estimated Value
Purchase Details
Closed on
Jan 16, 2006
Sold by
Pierce Patricia Crowley
Bought by
Petty Daniel S and Catlin Carol P
Purchase Details
Closed on
Dec 12, 2005
Sold by
Pierce Patricia Crowley
Bought by
Petty Daniel S and Catlin Carol P
Purchase Details
Closed on
Jan 10, 2004
Sold by
Pierce Patricia Crowley
Bought by
Petty Daniel S and Catlin Carol P
Purchase Details
Closed on
Dec 15, 2003
Sold by
Pierce Patricia Crowley
Bought by
Petty Daniel S and Catlin Carol P
Purchase Details
Closed on
Sep 7, 2002
Sold by
Pierce Patricia Crowley
Bought by
Petty Daniel S and Catlin Carol P
Purchase Details
Closed on
Jul 23, 2002
Sold by
Pierce Patricia Crowley
Bought by
John Hadley Pierce Credit Shelter Discla
Create a Home Valuation Report for This Property
The Home Valuation Report is an in-depth analysis detailing your home's value as well as a comparison with similar homes in the area
Purchase History
| Date | Buyer | Sale Price | Title Company |
|---|---|---|---|
| Leenstra Kelly | $2,925,280 | First American Title Insuran | |
| Petty Daniel S | -- | None Available | |
| Petty Daniel S | -- | None Available | |
| Petty Daniel S | -- | -- | |
| Petty Daniel S | -- | -- | |
| Petty Daniel S | -- | -- | |
| John Hadley Pierce Credit Shelter Discla | -- | -- |
Source: Public Records
Tax History
| Year | Tax Paid | Tax Assessment Tax Assessment Total Assessment is a certain percentage of the fair market value that is determined by local assessors to be the total taxable value of land and additions on the property. | Land | Improvement |
|---|---|---|---|---|
| 2025 | $42,088 | $3,577,086 | $3,116,500 | $460,586 |
| 2024 | $33,951 | $4,699,830 | $4,128,005 | $571,825 |
| 2023 | $33,951 | $4,051,114 | $3,558,218 | $492,896 |
| 2022 | $29,253 | $3,447,776 | $3,028,288 | $419,488 |
| 2021 | $26,068 | $2,780,540 | $2,442,234 | $338,306 |
| 2020 | $25,517 | $2,439,050 | $2,142,293 | $296,757 |
| 2019 | $23,141 | $2,315,187 | $2,033,500 | $281,687 |
| 2018 | $24,115 | $2,107,078 | $2,018,458 | $88,620 |
| 2017 | $21,298 | $1,870,390 | $1,791,725 | $78,665 |
| 2016 | $19,454 | $1,722,307 | $1,649,750 | $72,557 |
| 2015 | $19,114 | $1,647,655 | $1,578,762 | $68,893 |
| 2014 | -- | $1,570,591 | $1,504,935 | $65,656 |
| 2013 | -- | $1,480,825 | $1,419,750 | $61,075 |
Source: Public Records
Map
Nearby Homes
- 166 Soundview Rd
- 557 Whitecap Rd
- 251 Arbel Way
- 291 Arbel Way
- 1195 Brighton Crest Dr
- 1348 Chuckanut Dr
- 2408 Sonora Ln
- 157 Chuckanut Crest Dr
- 2404 Sonora Ln
- 1697 Chuckanut Crest Dr
- 405 Arbutus Place
- 417 Arbutus Place
- 414 S Clarkwood Dr
- 629 Arroyo Ln
- 1231 Broad St
- 1301 Broad St
- 505 Mulberry Rd
- 404 Willow Road Place
- 425 Chuckanut Dr N Unit 42
- 402 Willow Road Place
- 316 Chuckanut Point Rd
- 317 Chuckanut Point Rd
- 310 Chuckanut Point Rd
- 305 Chuckanut Point Rd
- 304 Chuckanut Point Rd
- 283 Chuckanut Point Rd
- 298 Chuckanut Point Rd
- 0 Heron Point Ln
- 292 Chuckanut Point Rd
- 286 Chuckanut Point Rd
- 280 Chuckanut Point Rd
- 601 Heron Point Ln
- 274 Chuckanut Point Rd
- 266 Chuckanut Point Rd
- 263 Chuckanut Point Rd
- 256 Chuckanut Point Rd
- 615 Pleasant Bay Rd
- 607 Pleasant Bay Rd
- 237 Chuckanut Point Rd
- 599 Pleasant Bay Rd
Your Personal Tour Guide
Ask me questions while you tour the home.