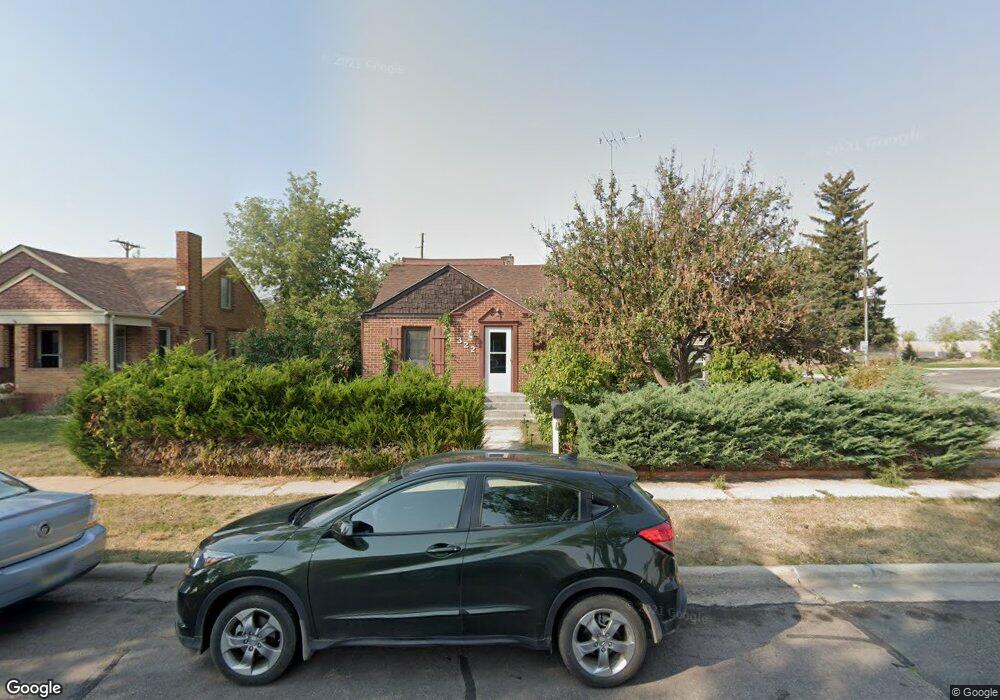
322 E 3rd Ave Cheyenne, WY 82001
Estimated Value: $352,091 - $363,000
4
Beds
2
Baths
1,220
Sq Ft
$293/Sq Ft
Est. Value
About This Home
This home is located at 322 E 3rd Ave, Cheyenne, WY 82001 and is currently estimated at $357,273, approximately $292 per square foot. 322 E 3rd Ave is a home located in Laramie County with nearby schools including Deming Elementary School, Miller Elementary School, and McCormick Junior High School.
Ownership History
Date
Name
Owned For
Owner Type
Purchase Details
Closed on
Dec 28, 2015
Sold by
Lathrop Macmillan Leetta J and Macmillan Jeddi
Bought by
Lathrop Macmillan Leetta J and Macmillan Jeddi
Current Estimated Value
Home Financials for this Owner
Home Financials are based on the most recent Mortgage that was taken out on this home.
Original Mortgage
$124,000
Outstanding Balance
$97,626
Interest Rate
3.98%
Mortgage Type
VA
Estimated Equity
$259,647
Purchase Details
Closed on
Nov 19, 2008
Sold by
Sky Oak
Bought by
Lathrop Leetta J
Home Financials for this Owner
Home Financials are based on the most recent Mortgage that was taken out on this home.
Original Mortgage
$98,697
Interest Rate
6.5%
Mortgage Type
FHA
Purchase Details
Closed on
Dec 10, 2002
Sold by
Sky Oak
Bought by
Sky Oak
Purchase Details
Closed on
Jul 19, 2002
Sold by
Courbis Richard Z
Bought by
Courbis Ii Richard Z and Sky Oak
Create a Home Valuation Report for This Property
The Home Valuation Report is an in-depth analysis detailing your home's value as well as a comparison with similar homes in the area
Purchase History
| Date | Buyer | Sale Price | Title Company |
|---|---|---|---|
| Lathrop Macmillan Leetta J | -- | None Available | |
| Lathrop Leetta J | -- | None Available | |
| Sky Oak | -- | -- | |
| Courbis Ii Richard Z | -- | -- |
Source: Public Records
Mortgage History
| Date | Status | Borrower | Loan Amount |
|---|---|---|---|
| Open | Lathrop Macmillan Leetta J | $124,000 | |
| Closed | Lathrop Leetta J | $98,697 |
Source: Public Records
Tax History
| Year | Tax Paid | Tax Assessment Tax Assessment Total Assessment is a certain percentage of the fair market value that is determined by local assessors to be the total taxable value of land and additions on the property. | Land | Improvement |
|---|---|---|---|---|
| 2025 | $1,794 | $21,468 | $3,327 | $18,141 |
| 2024 | $1,794 | $28,371 | $4,436 | $23,935 |
| 2023 | $1,922 | $30,178 | $4,436 | $25,742 |
| 2022 | $1,603 | $25,211 | $4,436 | $20,775 |
| 2021 | $1,346 | $21,605 | $4,436 | $17,169 |
| 2020 | $1,383 | $22,168 | $4,436 | $17,732 |
| 2019 | $1,314 | $21,193 | $4,436 | $16,757 |
| 2018 | $1,135 | $18,869 | $3,581 | $15,288 |
| 2017 | $1,122 | $18,549 | $3,581 | $14,968 |
| 2016 | $1,043 | $17,444 | $3,248 | $14,196 |
| 2015 | $1,006 | $16,929 | $3,248 | $13,681 |
| 2014 | $1,152 | $18,846 | $3,248 | $15,598 |
Source: Public Records
Map
Nearby Homes
- 223 E 5th Ave
- 3422 Warren Ave
- 306 E Pershing Blvd
- 316 E Pershing Blvd
- 109 W 1st Ave
- 305 E 28th St
- 322 W 6th Ave
- 3205 Reed Ave
- 1014 E 25th St Unit 203
- 4001 Snyder Ave
- 3515 Dillon Ave
- 414 E 22nd St
- 3341 Dunn Ave
- 601 W 25th St
- 906 Talbot Ct
- 3529 Amherst Rd
- 1117 W 31st St
- 1510 Seymour Ave
- 1301 E 23rd St
- 2515 Snyder Ave
Your Personal Tour Guide
Ask me questions while you tour the home.