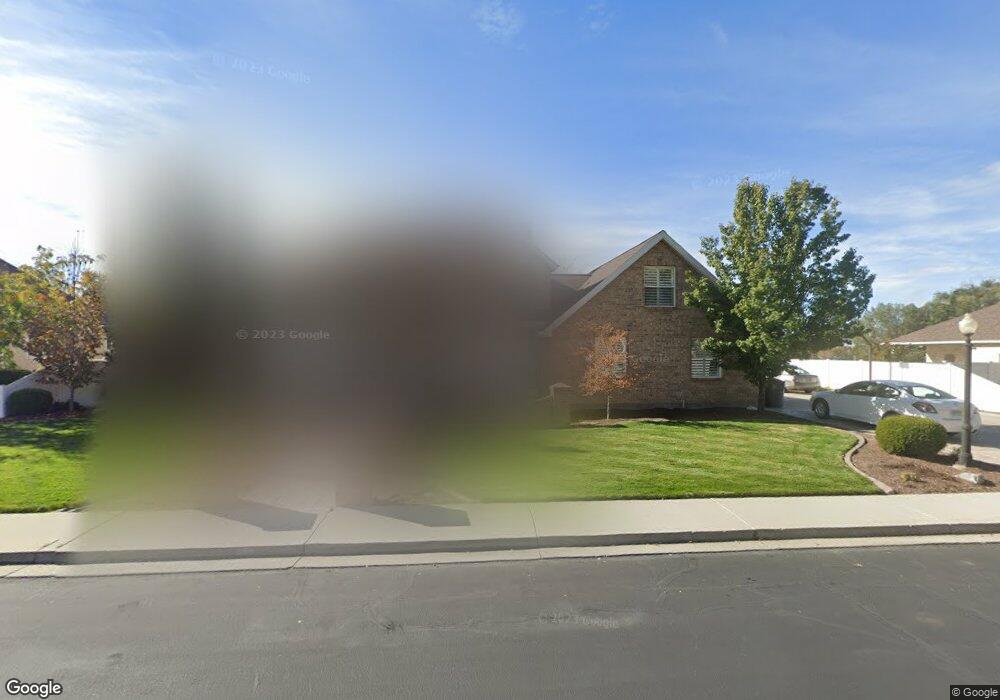
322 E 680 N Lindon, UT 84042
Estimated Value: $1,047,000 - $1,146,000
3
Beds
3
Baths
4,321
Sq Ft
$253/Sq Ft
Est. Value
About This Home
This home is located at 322 E 680 N, Lindon, UT 84042 and is currently estimated at $1,092,491, approximately $252 per square foot. 322 E 680 N is a home located in Utah County with nearby schools including Lindon Elementary School, Oak Canyon Junior High School, and Pleasant Grove High School.
Ownership History
Date
Name
Owned For
Owner Type
Purchase Details
Closed on
May 24, 2018
Sold by
Marquis Derek A and Marquis Colleen
Bought by
Marquis Derek A and Marquis Colleen C
Current Estimated Value
Purchase Details
Closed on
Mar 27, 2003
Sold by
Donaldson Matthew L
Bought by
Marquis Derek A and Marquis Colleen
Home Financials for this Owner
Home Financials are based on the most recent Mortgage that was taken out on this home.
Original Mortgage
$232,000
Outstanding Balance
$99,958
Interest Rate
5.79%
Estimated Equity
$992,533
Purchase Details
Closed on
Dec 17, 2002
Sold by
Hadaway Howard P and Hadaway Kathleen M
Bought by
Donaldson Matthew L
Purchase Details
Closed on
Mar 22, 2001
Sold by
Hall Matthew W and Hall Cristina
Bought by
Vance John A
Create a Home Valuation Report for This Property
The Home Valuation Report is an in-depth analysis detailing your home's value as well as a comparison with similar homes in the area
Home Values in the Area
Average Home Value in this Area
Purchase History
| Date | Buyer | Sale Price | Title Company |
|---|---|---|---|
| Marquis Derek A | -- | None Available | |
| Marquis Derek A | -- | Sundance Title Insurance Ag | |
| Donaldson Matthew L | $214,131 | -- | |
| Vance John A | -- | Sundance Title Insurance Ag |
Source: Public Records
Mortgage History
| Date | Status | Borrower | Loan Amount |
|---|---|---|---|
| Open | Marquis Derek A | $232,000 | |
| Closed | Marquis Derek A | $43,500 |
Source: Public Records
Tax History
| Year | Tax Paid | Tax Assessment Tax Assessment Total Assessment is a certain percentage of the fair market value that is determined by local assessors to be the total taxable value of land and additions on the property. | Land | Improvement |
|---|---|---|---|---|
| 2025 | $3,219 | $543,125 | -- | -- |
| 2024 | $3,219 | $396,770 | $0 | $0 |
| 2023 | $3,090 | $409,145 | $0 | $0 |
| 2022 | $3,106 | $397,320 | $0 | $0 |
| 2021 | $2,990 | $576,600 | $236,600 | $340,000 |
| 2020 | $2,855 | $542,000 | $215,100 | $326,900 |
| 2019 | $2,651 | $525,100 | $198,200 | $326,900 |
| 2018 | $2,721 | $508,200 | $181,300 | $326,900 |
| 2017 | $2,768 | $277,200 | $0 | $0 |
| 2016 | $2,945 | $272,800 | $0 | $0 |
| 2015 | $2,848 | $249,370 | $0 | $0 |
| 2014 | $2,613 | $226,655 | $0 | $0 |
Source: Public Records
Map
Nearby Homes
Your Personal Tour Guide
Ask me questions while you tour the home.