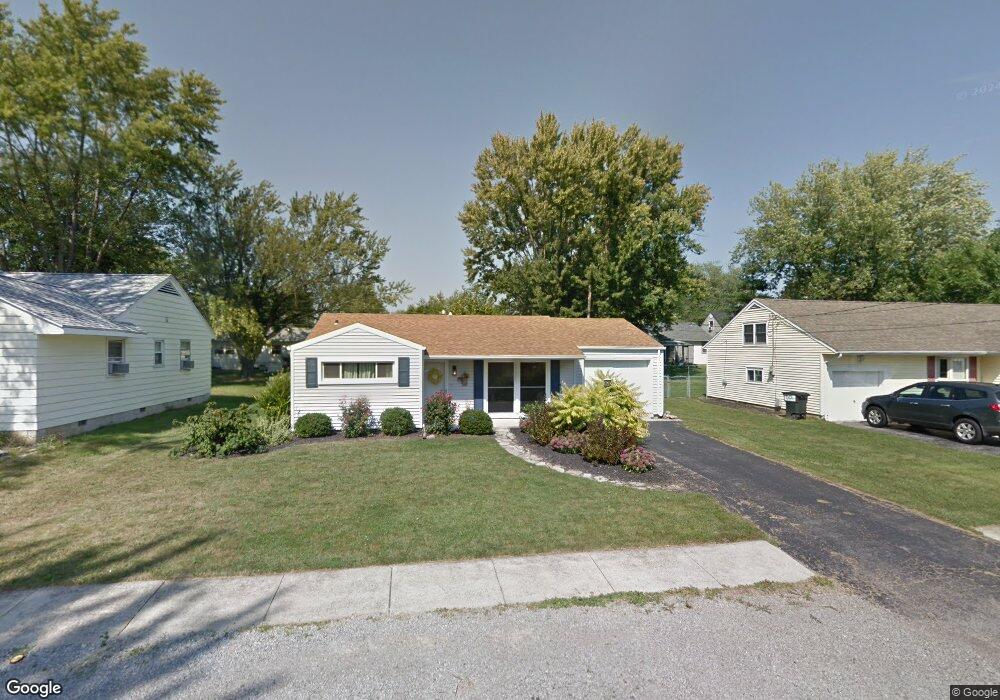
322 Elizabeth St Findlay, OH 45840
Estimated Value: $160,000 - $177,000
2
Beds
1
Bath
929
Sq Ft
$180/Sq Ft
Est. Value
About This Home
This home is located at 322 Elizabeth St, Findlay, OH 45840 and is currently estimated at $167,172, approximately $179 per square foot. 322 Elizabeth St is a home located in Hancock County with nearby schools including Northview Elementary School, Bigelow Hill Elementary School, and Glenwood Middle School.
Ownership History
Date
Name
Owned For
Owner Type
Purchase Details
Closed on
Apr 30, 2008
Sold by
Woolum Dorothy E
Bought by
Allender Meghan J
Current Estimated Value
Home Financials for this Owner
Home Financials are based on the most recent Mortgage that was taken out on this home.
Original Mortgage
$82,450
Outstanding Balance
$52,215
Interest Rate
5.88%
Mortgage Type
Purchase Money Mortgage
Estimated Equity
$114,957
Purchase Details
Closed on
Mar 3, 2004
Sold by
Preston Darryl K
Bought by
Woolum Dorothy E
Purchase Details
Closed on
Dec 14, 1998
Sold by
Chamberlain Clyde
Bought by
Preston Darryl
Home Financials for this Owner
Home Financials are based on the most recent Mortgage that was taken out on this home.
Original Mortgage
$58,900
Interest Rate
6.93%
Mortgage Type
New Conventional
Purchase Details
Closed on
Nov 7, 1985
Bought by
Chamberlain Clyde D and Chamberlain Edna
Create a Home Valuation Report for This Property
The Home Valuation Report is an in-depth analysis detailing your home's value as well as a comparison with similar homes in the area
Home Values in the Area
Average Home Value in this Area
Purchase History
| Date | Buyer | Sale Price | Title Company |
|---|---|---|---|
| Allender Meghan J | $85,000 | Golden Key Title Agency | |
| Woolum Dorothy E | $84,000 | -- | |
| Preston Darryl | $62,000 | -- | |
| Chamberlain Clyde D | $37,500 | -- |
Source: Public Records
Mortgage History
| Date | Status | Borrower | Loan Amount |
|---|---|---|---|
| Open | Allender Meghan J | $82,450 | |
| Previous Owner | Preston Darryl | $58,900 |
Source: Public Records
Tax History Compared to Growth
Tax History
| Year | Tax Paid | Tax Assessment Tax Assessment Total Assessment is a certain percentage of the fair market value that is determined by local assessors to be the total taxable value of land and additions on the property. | Land | Improvement |
|---|---|---|---|---|
| 2024 | $1,497 | $42,130 | $5,610 | $36,520 |
| 2023 | $1,499 | $42,130 | $5,610 | $36,520 |
| 2022 | $1,501 | $42,130 | $5,610 | $36,520 |
| 2021 | $1,348 | $33,120 | $5,610 | $27,510 |
| 2020 | $1,348 | $33,120 | $5,610 | $27,510 |
| 2019 | $1,459 | $33,120 | $5,610 | $27,510 |
| 2018 | $1,362 | $28,800 | $4,880 | $23,920 |
| 2017 | $626 | $28,800 | $4,880 | $23,920 |
| 2016 | $1,242 | $28,800 | $4,880 | $23,920 |
| 2015 | $1,068 | $24,430 | $4,880 | $19,550 |
| 2014 | $1,068 | $24,430 | $4,880 | $19,550 |
| 2012 | $992 | $22,500 | $4,880 | $17,620 |
Source: Public Records
Map
Nearby Homes
- 304 Prentiss Ave
- 304 Rector Ave
- 643 Edith Ave
- 1934 Geffs Ave
- 405 Clifton Ave
- 410 Monroe Ave
- 1820 N Main St
- 128 Harrington Ave
- 2100 Candlewick Dr
- 905 W Melrose Ave
- 1825 Pershing St
- 231 Tioga Ave
- 925 W Melrose Ave
- 506 Hillcrest Ave
- 615 Hillcrest Ave
- 933 Laurel Ln
- 126 Hillcrest Ave
- 604 Davis St
- 533 Davis St
- 3300 Crosshill Dr
- 322 Elizabeth Ave
- 318 Elizabeth St
- 318 Elizabeth Ave
- 326 Elizabeth St
- 321 Lexington Ave
- 317 Lexington Ave
- 325 Lexington Ave
- 312 Elizabeth St
- 312 Elizabeth Ave
- 332 Elizabeth St
- 319 Elizabeth St
- 323 Elizabeth Ave
- 315 Elizabeth St
- 323 Elizabeth St
- 313 Lexington Ave
- 329 Lexington Ave
- 311 Elizabeth St
- 308 Elizabeth St
- 308 Elizabeth Ave
- 327 Elizabeth St