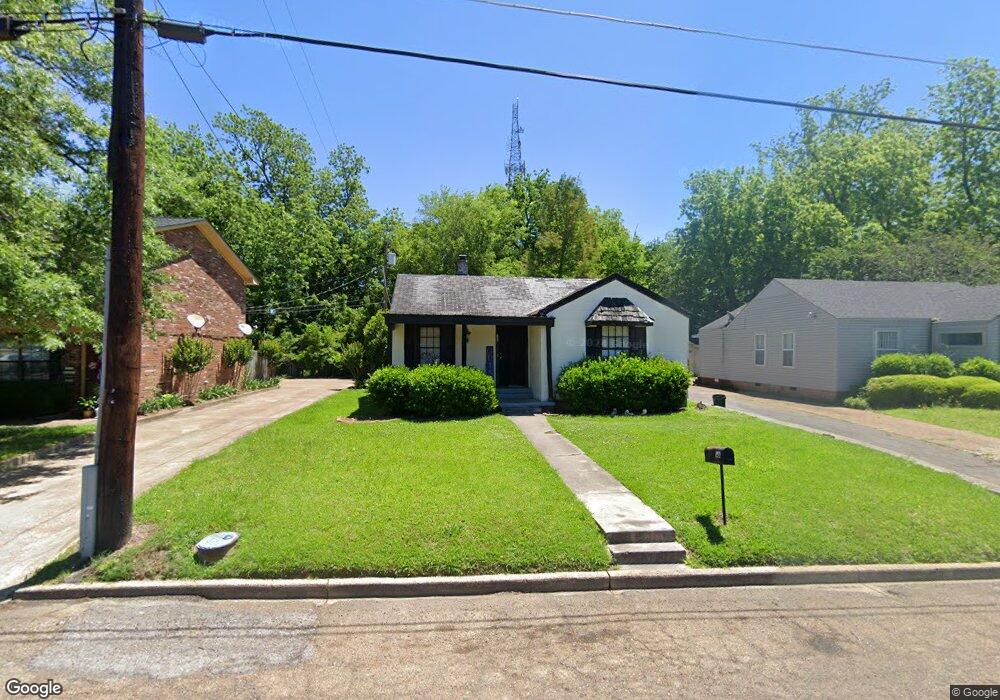
322 High St West Point, MS 39773
Estimated Value: $85,000 - $102,000
3
Beds
--
Bath
1,164
Sq Ft
$83/Sq Ft
Est. Value
About This Home
This home is located at 322 High St, West Point, MS 39773 and is currently estimated at $96,122, approximately $82 per square foot. 322 High St is a home located in Clay County with nearby schools including East Side Elementary School, West Clay Elementary School, and Church Hill Elementary School.
Ownership History
Date
Name
Owned For
Owner Type
Purchase Details
Closed on
Apr 9, 2020
Sold by
Secretary Housing Urban Development
Bought by
Lenoir Willie C
Current Estimated Value
Purchase Details
Closed on
Jul 28, 2009
Sold by
Cook Brian and Cook Nancy C
Bought by
Everson Joyce A
Purchase Details
Closed on
Jul 20, 2009
Sold by
Ford Twila S
Bought by
Cook Bryan and Cook Nancy
Purchase Details
Closed on
May 4, 2009
Sold by
Dionysus Llc
Bought by
Cook Brian
Create a Home Valuation Report for This Property
The Home Valuation Report is an in-depth analysis detailing your home's value as well as a comparison with similar homes in the area
Purchase History
| Date | Buyer | Sale Price | Title Company |
|---|---|---|---|
| Lenoir Willie C | -- | -- | |
| Everson Joyce A | -- | -- | |
| Cook Bryan | -- | -- | |
| Cook Brian | -- | -- |
Source: Public Records
Tax History
| Year | Tax Paid | Tax Assessment Tax Assessment Total Assessment is a certain percentage of the fair market value that is determined by local assessors to be the total taxable value of land and additions on the property. | Land | Improvement |
|---|---|---|---|---|
| 2025 | $370 | $6,819 | $796 | $6,023 |
| 2024 | $370 | $6,819 | $796 | $6,023 |
| 2023 | $851 | $5,689 | $796 | $4,893 |
| 2022 | $310 | $5,689 | $796 | $4,893 |
| 2021 | $308 | $5,689 | $796 | $4,893 |
| 2020 | $309 | $5,689 | $796 | $4,893 |
| 2019 | $115 | $3,762 | $530 | $3,232 |
| 2018 | $109 | $3,762 | $530 | $3,232 |
| 2017 | $109 | $3,762 | $530 | $3,232 |
| 2016 | $104 | $3,762 | $530 | $3,232 |
| 2015 | $97 | $3,357 | $530 | $2,827 |
| 2014 | $218 | $3,357 | $530 | $2,827 |
| 2013 | $218 | $3,357 | $530 | $2,827 |
Source: Public Records
Map
Nearby Homes
- 229 S Division St
- 228 S Division St
- 33 Court
- 159 Washington St
- 184 Tournament St
- 13 Cul de Sac St
- 0 Mississippi 50
- 123 Cottrell St
- 33 Dix St
- 440 Calhoun St
- 0 U S 45 Alternate
- 26788 E Main St
- 963 E Broad St
- 238 Calhoun St
- 26852 E Main St
- 98 Calhoun St
- 65 Calhoun St
- 74 Tom Bayne St
- 551 E Westbrook St
- 600 E Westbrook St
- 164 High St
- 162 High St
- 456 W Broad St
- 452 W Broad St
- 450 W Broad St
- 120 W Broad St
- 403 High St
- 205 W Broad St
- 217 W Broad St
- 427 S Division St
- 321 S Division St
- 315 S Division St
- 404 Griffin St
- 329 S Division St
- 335 S Division St
- 104 W Broad St
- 133 W Broad St
- 414 Griffin St
- 123 W Broad St
- 471 W Broad St
Your Personal Tour Guide
Ask me questions while you tour the home.