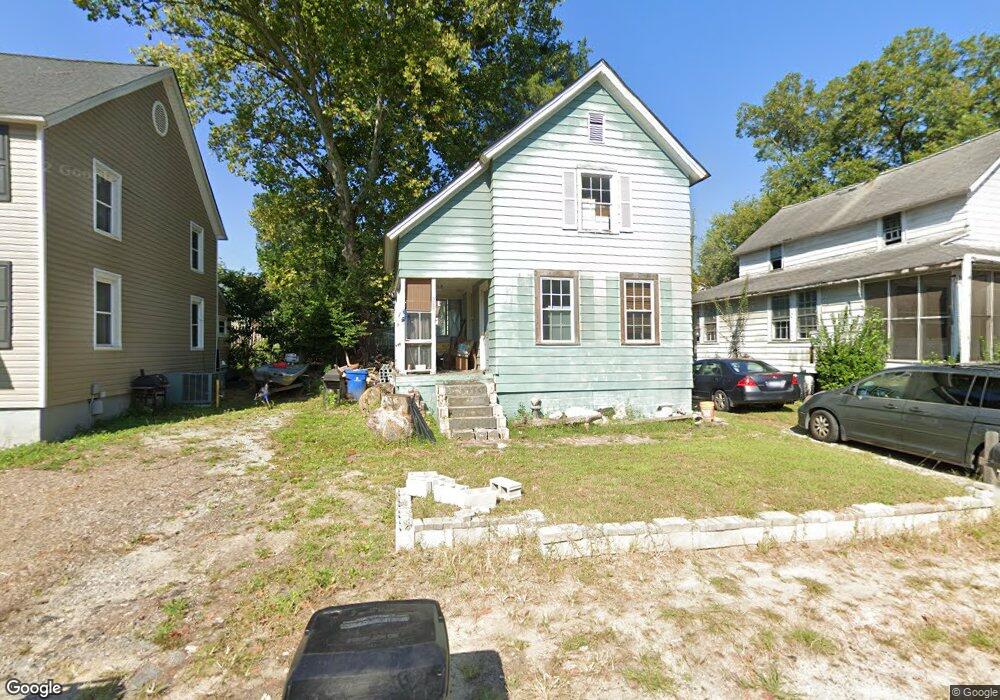
322 Hudson St West Columbia, SC 29169
Estimated Value: $97,000 - $223,000
2
Beds
1
Bath
1,271
Sq Ft
$126/Sq Ft
Est. Value
About This Home
This home is located at 322 Hudson St, West Columbia, SC 29169 and is currently estimated at $160,000, approximately $125 per square foot. 322 Hudson St is a home located in Lexington County with nearby schools including Cayce Elementary, Cyril B. Busbee Creative Arts Academy, and Brookland-Cayce High School.
Ownership History
Date
Name
Owned For
Owner Type
Purchase Details
Closed on
Jan 27, 2023
Sold by
Truett Sean
Bought by
Cedar Creek Investors Llc
Current Estimated Value
Home Financials for this Owner
Home Financials are based on the most recent Mortgage that was taken out on this home.
Original Mortgage
$42,000
Outstanding Balance
$28,605
Interest Rate
6.31%
Mortgage Type
New Conventional
Estimated Equity
$131,395
Purchase Details
Closed on
Jul 21, 2006
Sold by
Berg Kenneth R
Bought by
Truett Sean
Home Financials for this Owner
Home Financials are based on the most recent Mortgage that was taken out on this home.
Original Mortgage
$59,300
Interest Rate
6.54%
Mortgage Type
New Conventional
Purchase Details
Closed on
Feb 22, 2001
Sold by
Master In Equity
Bought by
Ra Properties
Purchase Details
Closed on
Feb 20, 2001
Sold by
Golden Hills Inc
Bought by
Oswald Carlton M
Create a Home Valuation Report for This Property
The Home Valuation Report is an in-depth analysis detailing your home's value as well as a comparison with similar homes in the area
Home Values in the Area
Average Home Value in this Area
Purchase History
| Date | Buyer | Sale Price | Title Company |
|---|---|---|---|
| Cedar Creek Investors Llc | $56,000 | -- | |
| Truett Sean | $59,300 | None Available | |
| Ra Properties | $30,000 | -- | |
| Oswald Carlton M | $58,000 | -- |
Source: Public Records
Mortgage History
| Date | Status | Borrower | Loan Amount |
|---|---|---|---|
| Open | Cedar Creek Investors Llc | $42,000 | |
| Previous Owner | Truett Sean | $59,300 |
Source: Public Records
Tax History Compared to Growth
Tax History
| Year | Tax Paid | Tax Assessment Tax Assessment Total Assessment is a certain percentage of the fair market value that is determined by local assessors to be the total taxable value of land and additions on the property. | Land | Improvement |
|---|---|---|---|---|
| 2024 | $1,445 | $3,360 | $1,500 | $1,860 |
| 2023 | $1,327 | $3,753 | $1,500 | $2,253 |
| 2022 | $1,402 | $3,753 | $1,500 | $2,253 |
| 2020 | $1,329 | $3,753 | $1,500 | $2,253 |
| 2019 | $1,250 | $3,494 | $1,161 | $2,333 |
| 2018 | $1,239 | $3,494 | $1,161 | $2,333 |
| 2017 | $1,216 | $3,494 | $1,161 | $2,333 |
| 2016 | $1,231 | $3,493 | $1,160 | $2,333 |
| 2014 | $931 | $3,037 | $1,035 | $2,002 |
| 2013 | -- | $3,040 | $1,040 | $2,000 |
Source: Public Records
Map
Nearby Homes
- 214 Saint Anns Alley
- 101 Shuler St
- 515 Center St
- 120 River Flow Ct
- 100 River Flow Ct
- 706 Violet St
- 1249 Jessamine St
- 908 B Ave
- 523 Gervais St
- 613 Lafayette Ave
- 827 Indigo Ave
- 1324 Pulaski St Unit A-303
- 1028 Augusta St
- 1011 D Ave
- 222 Tryon St
- 928 Indigo Ave
- 611 Naples Ave
- 103 Chicorana Rd
- 1810 1st St
- 502A Koon St