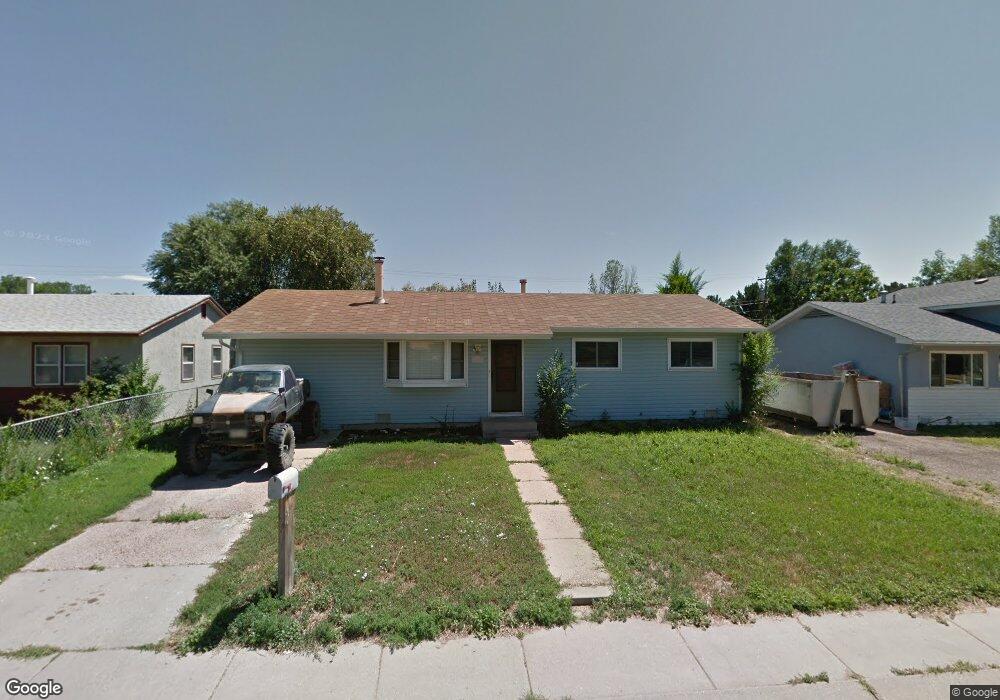
322 Mount View Ln Unit FOU Fountain, CO 80817
Downtown Fountain NeighborhoodEstimated Value: $296,998 - $325,000
2
Beds
1
Bath
960
Sq Ft
$324/Sq Ft
Est. Value
About This Home
This home is located at 322 Mount View Ln Unit FOU, Fountain, CO 80817 and is currently estimated at $311,250, approximately $324 per square foot. 322 Mount View Ln Unit FOU is a home located in El Paso County with nearby schools including Aragon Elementary School, Fountain Middle School, and Fountain-Fort Carson High School.
Ownership History
Date
Name
Owned For
Owner Type
Purchase Details
Closed on
May 12, 2017
Sold by
Rodriquez Gilbert R and Rodriquez Elena M
Bought by
David Lori Ann
Current Estimated Value
Home Financials for this Owner
Home Financials are based on the most recent Mortgage that was taken out on this home.
Original Mortgage
$144,900
Outstanding Balance
$120,634
Interest Rate
4.14%
Mortgage Type
New Conventional
Estimated Equity
$190,616
Purchase Details
Closed on
Feb 22, 2001
Sold by
Rodriguez Gilbert R and Henry Elena M
Bought by
Rodriguez Gilbert R and Rodriguez Elena M
Purchase Details
Closed on
Nov 25, 1998
Sold by
Evans John J
Bought by
Rodriguez Gilbert R and Henry Elena M
Purchase Details
Closed on
May 24, 1994
Sold by
Ortega Dolores and Ortega Jo Anna
Bought by
Evans John J
Home Financials for this Owner
Home Financials are based on the most recent Mortgage that was taken out on this home.
Original Mortgage
$52,020
Interest Rate
9%
Mortgage Type
VA
Create a Home Valuation Report for This Property
The Home Valuation Report is an in-depth analysis detailing your home's value as well as a comparison with similar homes in the area
Home Values in the Area
Average Home Value in this Area
Purchase History
| Date | Buyer | Sale Price | Title Company |
|---|---|---|---|
| David Lori Ann | $161,000 | Unified Title Co | |
| Rodriguez Gilbert R | -- | -- | |
| Rodriguez Gilbert R | -- | -- | |
| Evans John J | $51,000 | -- |
Source: Public Records
Mortgage History
| Date | Status | Borrower | Loan Amount |
|---|---|---|---|
| Open | David Lori Ann | $144,900 | |
| Previous Owner | Evans John J | $52,020 |
Source: Public Records
Tax History Compared to Growth
Tax History
| Year | Tax Paid | Tax Assessment Tax Assessment Total Assessment is a certain percentage of the fair market value that is determined by local assessors to be the total taxable value of land and additions on the property. | Land | Improvement |
|---|---|---|---|---|
| 2025 | $1,041 | $20,650 | -- | -- |
| 2024 | $900 | $21,100 | $3,390 | $17,710 |
| 2022 | $810 | $13,890 | $2,700 | $11,190 |
| 2021 | $753 | $14,300 | $2,780 | $11,520 |
| 2020 | $662 | $12,310 | $2,430 | $9,880 |
| 2019 | $650 | $12,310 | $2,430 | $9,880 |
| 2018 | $441 | $8,070 | $2,160 | $5,910 |
| 2017 | $436 | $8,070 | $2,160 | $5,910 |
| 2016 | $428 | $7,920 | $2,150 | $5,770 |
| 2015 | $429 | $7,920 | $2,150 | $5,770 |
| 2014 | $406 | $7,540 | $2,150 | $5,390 |
Source: Public Records
Map
Nearby Homes
- 323 Mount View Ln
- 307 Mount View Ln
- 326 Columbine St
- 330 Columbine St
- 418 Linda Vista Dr
- 420 Rosewood Dr
- 521 Clearview Dr
- 157 Wellington St
- 9735 Cronin St
- 119 E Ohio Ave Unit 11 & 12
- 1005 Grinde Dr
- 900 Pond Terrace
- 6856 Fountain Vista Cir
- 103 Mojave Way
- 575 Blossom Field Rd
- 579 Blossom Field Rd
- 1107 Grinde Dr
- 585 Blossom Field Rd
- 329 E Missouri Ave
- 929 Desert Cir
- 318 Mount View Ln
- 326 Mount View Ln
- 314 Mount View Ln
- 330 Mount View Ln
- 319 Mount View Ln
- 315 Mount View Ln
- 310 Mount View Ln
- 311 Mount View Ln
- 327 Mount View Ln
- 306 Mount View Ln
- 338 Mount View Ln
- 331 Mount View Ln
- 314 Linda Vista Dr
- 318 Linda Vista Dr
- 310 Linda Vista Dr
- 601 Dale St
- 302 Mount View Ln
- 342 Mount View Ln
- 335 Mount View Ln
- 306 Linda Vista Dr