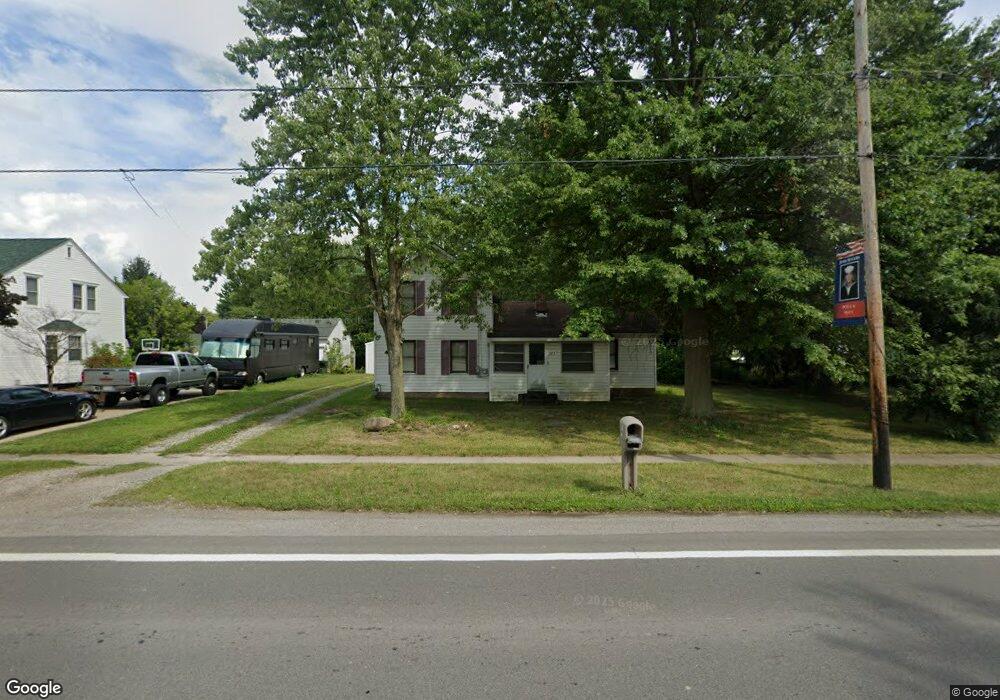
322 N Center St Lagrange, OH 44050
Estimated Value: $168,000 - $215,000
3
Beds
2
Baths
1,676
Sq Ft
$115/Sq Ft
Est. Value
About This Home
This home is located at 322 N Center St, Lagrange, OH 44050 and is currently estimated at $192,592, approximately $114 per square foot. 322 N Center St is a home located in Lorain County with nearby schools including Keystone Elementary School, Keystone Middle School, and Keystone High School.
Ownership History
Date
Name
Owned For
Owner Type
Purchase Details
Closed on
May 21, 2019
Sold by
Casteel Patricia
Bought by
Casteel Brian R
Current Estimated Value
Purchase Details
Closed on
Sep 20, 2010
Sold by
Household Realty Corporation
Bought by
Casteel Ronald and Casteel Patricia
Purchase Details
Closed on
Mar 24, 2010
Sold by
Brandenburg Dennis S and Brandenburg Sonja K
Bought by
Household Realty Corporation
Purchase Details
Closed on
Aug 26, 1994
Sold by
Collins Michael E
Bought by
Brandenburg Dennis S and Brandenburg Sonya K
Home Financials for this Owner
Home Financials are based on the most recent Mortgage that was taken out on this home.
Original Mortgage
$77,400
Interest Rate
8.72%
Mortgage Type
New Conventional
Create a Home Valuation Report for This Property
The Home Valuation Report is an in-depth analysis detailing your home's value as well as a comparison with similar homes in the area
Home Values in the Area
Average Home Value in this Area
Purchase History
| Date | Buyer | Sale Price | Title Company |
|---|---|---|---|
| Casteel Brian R | -- | None Available | |
| Casteel Ronald | $37,000 | Attorney | |
| Household Realty Corporation | -- | None Available | |
| Brandenburg Dennis S | $86,000 | -- |
Source: Public Records
Mortgage History
| Date | Status | Borrower | Loan Amount |
|---|---|---|---|
| Previous Owner | Brandenburg Dennis S | $77,400 |
Source: Public Records
Tax History Compared to Growth
Tax History
| Year | Tax Paid | Tax Assessment Tax Assessment Total Assessment is a certain percentage of the fair market value that is determined by local assessors to be the total taxable value of land and additions on the property. | Land | Improvement |
|---|---|---|---|---|
| 2024 | $1,971 | $46,470 | $9,044 | $37,426 |
| 2023 | $1,911 | $37,632 | $9,699 | $27,934 |
| 2022 | $1,898 | $37,632 | $9,699 | $27,934 |
| 2021 | $1,899 | $37,632 | $9,699 | $27,934 |
| 2020 | $1,733 | $30,600 | $7,890 | $22,710 |
| 2019 | $1,723 | $30,600 | $7,890 | $22,710 |
| 2018 | $1,713 | $30,600 | $7,890 | $22,710 |
| 2017 | $1,763 | $30,360 | $5,780 | $24,580 |
| 2016 | $1,751 | $30,360 | $5,780 | $24,580 |
| 2015 | $1,749 | $30,360 | $5,780 | $24,580 |
| 2014 | $1,353 | $26,630 | $5,070 | $21,560 |
| 2013 | $1,313 | $26,630 | $5,070 | $21,560 |
Source: Public Records
Map
Nearby Homes
- 433 N Center St
- 516 Appomattox Ct
- 128 Harvest Ct
- 171 Keywood Blvd
- 194 Railroad St
- 548 William St
- 110 Railroad St
- 607 Rundle St
- 0 Dill Ct Unit 5072837
- 630 Rundle St
- 756 N Center St
- 40725 Biggs Rd
- 808 Buckingham Dr
- 800 Buckingham Dr
- 822 Robinson Dr
- 829 Robinson Dr
- 831 Robinson Dr
- 41635 Parsons Rd
- 19045 Whitehead Rd
- 40175 Banks Rd
- 326 N Center St
- 314 N Center St
- 108 Forest St
- 112 Forest St
- 310 N Center St
- 323 Church St
- 317 Church St
- 327 Church St
- 319 N Center St
- 313 Church St
- 323 N Center St
- 114 Forest St
- 311 N Center St
- 400 N Center St
- 309 Church St
- 327 N Center St
- 111 Forest St
- 307 N Center St
- 401 N Center St
- 305 N Center St