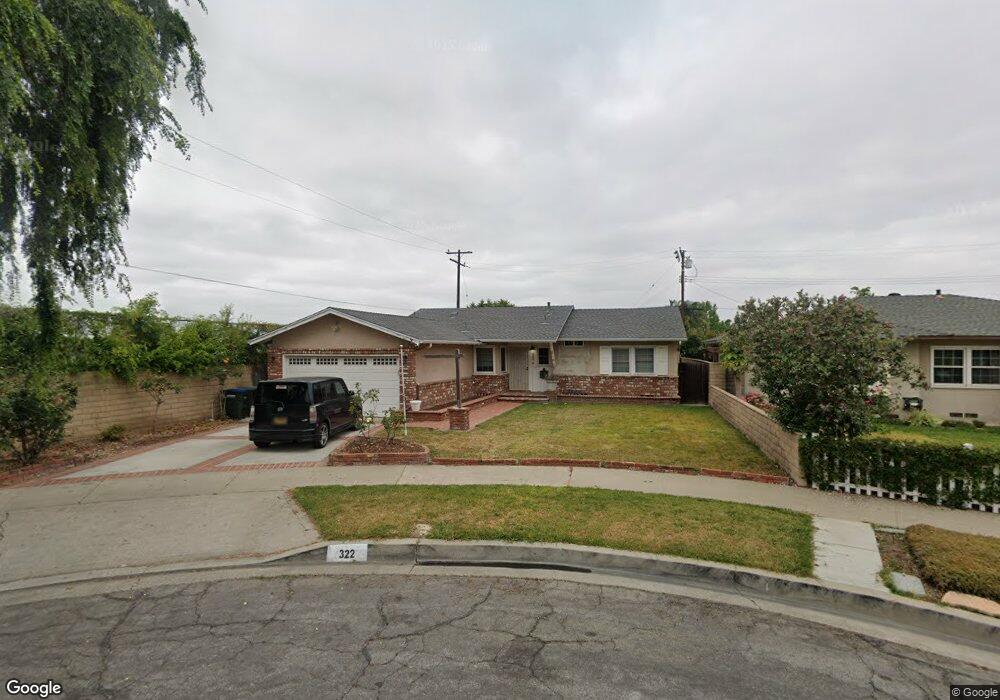
322 N Elm St Orange, CA 92868
Estimated Value: $911,188 - $1,100,000
3
Beds
2
Baths
1,247
Sq Ft
$795/Sq Ft
Est. Value
About This Home
This home is located at 322 N Elm St, Orange, CA 92868 and is currently estimated at $991,297, approximately $794 per square foot. 322 N Elm St is a home located in Orange County with nearby schools including Sycamore Elementary School, Portola Middle School, and Orange High School.
Ownership History
Date
Name
Owned For
Owner Type
Purchase Details
Closed on
Dec 29, 2015
Sold by
Heer Timothy J
Bought by
Heer Karen
Current Estimated Value
Home Financials for this Owner
Home Financials are based on the most recent Mortgage that was taken out on this home.
Original Mortgage
$169,100
Interest Rate
3.94%
Mortgage Type
New Conventional
Purchase Details
Closed on
Nov 10, 2015
Sold by
Heer Karen L
Bought by
Heer Christi and Heer Karen
Home Financials for this Owner
Home Financials are based on the most recent Mortgage that was taken out on this home.
Original Mortgage
$169,100
Interest Rate
3.94%
Mortgage Type
New Conventional
Purchase Details
Closed on
Feb 15, 2012
Sold by
Heer Timothy J and Heer Karen L
Bought by
Heer Timothy J and Heer Karen L
Purchase Details
Closed on
Feb 1, 2012
Sold by
Desutter Helen M
Bought by
Heer Karen L and The Helen M De Sutter Residence Trust
Purchase Details
Closed on
Oct 26, 2001
Sold by
Desutter Edmund J and Desutter Helen
Bought by
Desutter Edmund J and Desutter Helen M
Create a Home Valuation Report for This Property
The Home Valuation Report is an in-depth analysis detailing your home's value as well as a comparison with similar homes in the area
Home Values in the Area
Average Home Value in this Area
Purchase History
| Date | Buyer | Sale Price | Title Company |
|---|---|---|---|
| Heer Karen | $178,000 | Lawyers Title | |
| Howell Susan | $178,000 | Lawyers Title | |
| Heer Christi | $178,000 | Lawyers Title | |
| Heer Timothy J | -- | None Available | |
| Heer Karen L | -- | None Available | |
| Desutter Edmund J | -- | -- |
Source: Public Records
Mortgage History
| Date | Status | Borrower | Loan Amount |
|---|---|---|---|
| Closed | Howell Susan | $169,100 |
Source: Public Records
Tax History
| Year | Tax Paid | Tax Assessment Tax Assessment Total Assessment is a certain percentage of the fair market value that is determined by local assessors to be the total taxable value of land and additions on the property. | Land | Improvement |
|---|---|---|---|---|
| 2025 | $2,793 | $231,639 | $181,168 | $50,471 |
| 2024 | $2,793 | $227,098 | $177,616 | $49,482 |
| 2023 | $2,729 | $222,646 | $174,134 | $48,512 |
| 2022 | $2,673 | $218,281 | $170,720 | $47,561 |
| 2021 | $2,602 | $214,001 | $167,372 | $46,629 |
| 2020 | $2,578 | $211,807 | $165,656 | $46,151 |
| 2019 | $2,549 | $207,654 | $162,407 | $45,247 |
| 2018 | $2,511 | $203,583 | $159,223 | $44,360 |
| 2017 | $2,413 | $199,592 | $156,101 | $43,491 |
| 2016 | $951 | $58,520 | $23,258 | $35,262 |
| 2015 | $936 | $57,641 | $22,908 | $34,733 |
| 2014 | $916 | $56,512 | $22,459 | $34,053 |
Source: Public Records
Map
Nearby Homes
- 173 N Holly St
- 2022 W Spruce Ave
- 2042 W Beverly Dr
- 1139 W Sycamore Ave
- 2234 W Palm Ave
- 2244 W Beverly Dr
- 225 S Feldner Rd
- 190 N Flower St
- 246 N Donneybrooke St
- 327 N Clark St
- 1910 W Palmyra Ave Unit 139
- 1910 W Palmyra Ave Unit 4
- 1910 W Palmyra Ave Unit 46
- 151 S Parker St
- 3435 - 3437 W Park Balboa Ave
- 2100 W Palmyra Ave Unit 33
- 400 S Flower St Unit 99
- 400 S Flower St Unit 105
- 300 N Rampart St Unit 157
- 300 N Rampart St Unit 152
Your Personal Tour Guide
Ask me questions while you tour the home.