322 N Seymour Unit 3 Mesa, AZ 85207
Central Mesa East NeighborhoodEstimated Value: $347,376 - $469,000
--
Bed
3
Baths
1,591
Sq Ft
$255/Sq Ft
Est. Value
About This Home
This home is located at 322 N Seymour Unit 3, Mesa, AZ 85207 and is currently estimated at $406,094, approximately $255 per square foot. 322 N Seymour Unit 3 is a home located in Maricopa County with nearby schools including Salk Elementary School, Franklin at Brimhall Elementary School, and Franklin West Elementary School.
Ownership History
Date
Name
Owned For
Owner Type
Purchase Details
Closed on
Oct 13, 2005
Sold by
Mortensen Richard and Mortensen Gloria
Bought by
Hughes Mace Anthony and Hughes Kelly Lynn
Current Estimated Value
Home Financials for this Owner
Home Financials are based on the most recent Mortgage that was taken out on this home.
Original Mortgage
$260,316
Outstanding Balance
$140,822
Interest Rate
5.93%
Mortgage Type
VA
Estimated Equity
$265,272
Purchase Details
Closed on
Aug 19, 2005
Sold by
Mathison Nathan L and Mathison Stephanie R
Bought by
Mortensen Richard and Mortensen Gloria
Home Financials for this Owner
Home Financials are based on the most recent Mortgage that was taken out on this home.
Original Mortgage
$260,316
Outstanding Balance
$140,822
Interest Rate
5.93%
Mortgage Type
VA
Estimated Equity
$265,272
Purchase Details
Closed on
Nov 24, 2003
Sold by
Scott Homes Llc
Bought by
Mathison Nathan L and Raber Stephanie R
Home Financials for this Owner
Home Financials are based on the most recent Mortgage that was taken out on this home.
Original Mortgage
$145,245
Interest Rate
6%
Mortgage Type
FHA
Create a Home Valuation Report for This Property
The Home Valuation Report is an in-depth analysis detailing your home's value as well as a comparison with similar homes in the area
Home Values in the Area
Average Home Value in this Area
Purchase History
| Date | Buyer | Sale Price | Title Company |
|---|---|---|---|
| Hughes Mace Anthony | $252,000 | Lawyers Title Ins | |
| Mortensen Richard | $215,000 | First American Title Ins Co | |
| Mathison Nathan L | $147,525 | Security Title Agency |
Source: Public Records
Mortgage History
| Date | Status | Borrower | Loan Amount |
|---|---|---|---|
| Open | Hughes Mace Anthony | $260,316 | |
| Previous Owner | Mathison Nathan L | $145,245 |
Source: Public Records
Tax History Compared to Growth
Tax History
| Year | Tax Paid | Tax Assessment Tax Assessment Total Assessment is a certain percentage of the fair market value that is determined by local assessors to be the total taxable value of land and additions on the property. | Land | Improvement |
|---|---|---|---|---|
| 2025 | $1,259 | $15,164 | -- | -- |
| 2024 | $1,273 | $14,442 | -- | -- |
| 2023 | $1,273 | $28,230 | $5,640 | $22,590 |
| 2022 | $1,245 | $21,110 | $4,220 | $16,890 |
| 2021 | $1,279 | $19,730 | $3,940 | $15,790 |
| 2020 | $1,262 | $17,400 | $3,480 | $13,920 |
| 2019 | $1,169 | $15,580 | $3,110 | $12,470 |
| 2018 | $1,116 | $14,450 | $2,890 | $11,560 |
| 2017 | $1,081 | $13,750 | $2,750 | $11,000 |
| 2016 | $1,062 | $13,160 | $2,630 | $10,530 |
| 2015 | $1,002 | $12,370 | $2,470 | $9,900 |
Source: Public Records
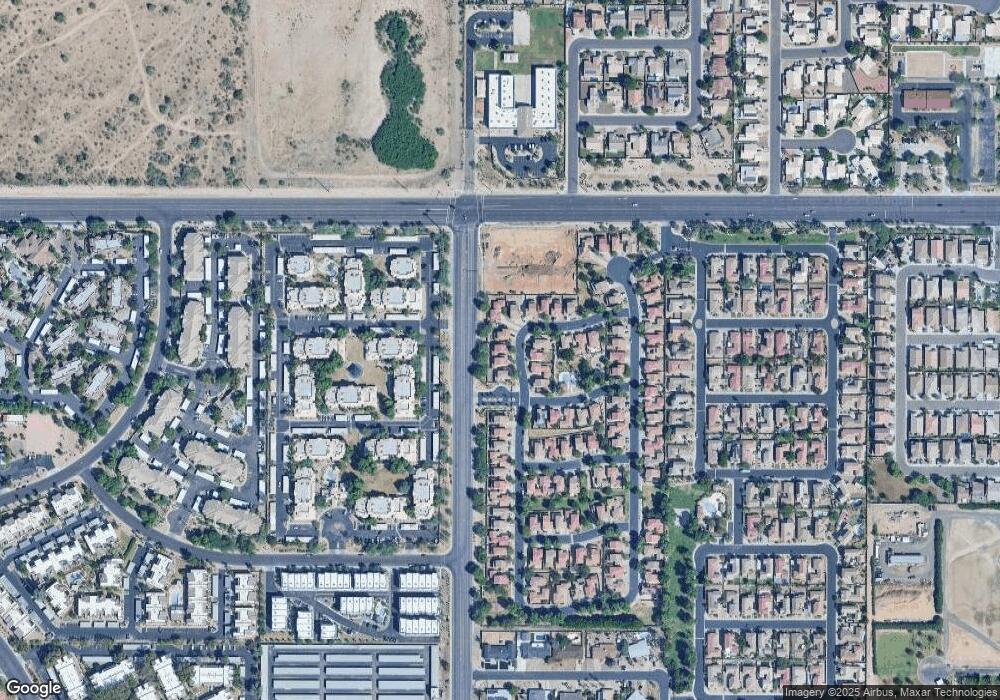
Map
Nearby Homes
- 7531 E Billings St Unit 145
- 7531 E Billings St Unit 146
- 7747 E Billings St Unit 81
- 7601 E Albany St
- 304 N 78th Place
- 7750 E Albany St Unit 49
- 145 N 74th St Unit 108
- 145 N 74th St Unit 147
- 145 N 74th St Unit 236
- 145 N 74th St Unit 127
- 145 N 74th St Unit 122
- 145 N 74th St Unit 207
- 205 N 74th St Unit 248
- 205 N 74th St Unit 151
- 205 N 74th St Unit 126
- 205 N 74th St Unit 260
- 7702 E Decatur St
- 7165 E University Dr Unit 171
- XXX E Compound Lot 2 Trail E Unit E
- XXX E Compound Lot 2 Trail E Unit 2
- 318 N Seymour Unit 2
- 326 N Seymour Unit 4
- 314 N Seymour Unit 1
- 332 N Seymour Unit 5
- 317 N Seymour Unit 86
- 321 N Seymour Unit 85
- 7614 E Butte St Unit 6
- 313 N Seymour Unit 87
- 7620 E Butte St Unit 7
- 309 N Seymour Unit 88
- 7626 E Butte St Unit 8
- 7633 E Butte St Unit 84
- 7632 E Butte St Unit 9
- 258 N Seymour Unit 89
- 7625 E Billings St Unit 73
- 7639 E Butte St Unit 83
- 7636 E Butte St Unit 10
- 254 N Seymour Unit 90
- 7631 E Billings St Unit 74
- 7645 E Butte St Unit 82