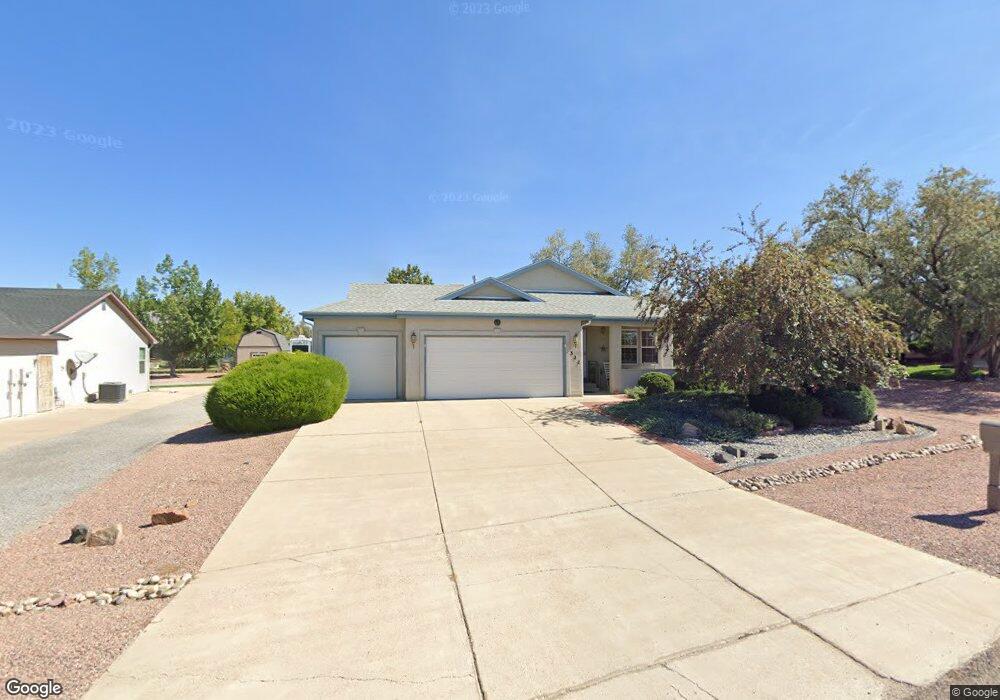
322 S Casper Dr Pueblo, CO 81007
Estimated Value: $361,557 - $423,000
3
Beds
2
Baths
1,562
Sq Ft
$255/Sq Ft
Est. Value
About This Home
This home is located at 322 S Casper Dr, Pueblo, CO 81007 and is currently estimated at $397,639, approximately $254 per square foot. 322 S Casper Dr is a home located in Pueblo County with nearby schools including Sierra Vista Elementary School, Sky View Middle School, and Pueblo West High School.
Ownership History
Date
Name
Owned For
Owner Type
Purchase Details
Closed on
Apr 20, 2007
Sold by
Bussey Duane N and Bussey Steven D
Bought by
Nelson Helen Loretta and Taylor Fred E
Current Estimated Value
Purchase Details
Closed on
Nov 20, 2006
Sold by
Bussey Beryl I
Bought by
Bussey Duane N and Bussey Steven D
Purchase Details
Closed on
Oct 31, 2006
Sold by
Bussey Beryl I
Bought by
Bussey Beryl I
Purchase Details
Closed on
Feb 13, 2003
Sold by
Bussey Beryl L
Bought by
Crenshaw William Theodore Est
Purchase Details
Closed on
Jan 7, 2003
Sold by
Crenshaw
Bought by
Bussey Beryl L
Purchase Details
Closed on
Aug 21, 2001
Bought by
Crenshaw William Theodore
Purchase Details
Closed on
Feb 16, 2001
Sold by
Oakwood Construction Co
Bought by
Crenshaw William Theodore
Purchase Details
Closed on
Mar 17, 1999
Bought by
Oakwood Construction Co
Create a Home Valuation Report for This Property
The Home Valuation Report is an in-depth analysis detailing your home's value as well as a comparison with similar homes in the area
Home Values in the Area
Average Home Value in this Area
Purchase History
| Date | Buyer | Sale Price | Title Company |
|---|---|---|---|
| Nelson Helen Loretta | $185,000 | Land Title Guarantee Company | |
| Bussey Duane N | -- | None Available | |
| Bussey Beryl I | -- | None Available | |
| Crenshaw William Theodore Est | -- | -- | |
| Bussey Beryl L | -- | -- | |
| Crenshaw William Theodore | -- | -- | |
| Crenshaw William Theodore | $136,200 | -- | |
| Oakwood Construction Co | $9,000 | -- |
Source: Public Records
Tax History Compared to Growth
Tax History
| Year | Tax Paid | Tax Assessment Tax Assessment Total Assessment is a certain percentage of the fair market value that is determined by local assessors to be the total taxable value of land and additions on the property. | Land | Improvement |
|---|---|---|---|---|
| 2024 | $1,194 | $18,480 | -- | -- |
| 2023 | $1,207 | $22,170 | $3,020 | $19,150 |
| 2022 | $1,006 | $16,882 | $2,610 | $14,272 |
| 2021 | $1,030 | $17,360 | $2,680 | $14,680 |
| 2020 | $697 | $17,360 | $2,680 | $14,680 |
| 2019 | $695 | $13,736 | $1,180 | $12,556 |
| 2018 | $619 | $12,234 | $1,188 | $11,046 |
| 2017 | $1,225 | $12,234 | $1,188 | $11,046 |
| 2016 | $1,222 | $12,228 | $1,791 | $10,437 |
| 2015 | $1,212 | $12,228 | $1,791 | $10,437 |
| 2014 | $601 | $12,128 | $1,791 | $10,337 |
Source: Public Records
Map
Nearby Homes
- 293 W Hahns Peak Ave
- 277 W Ben Hogan Dr
- 337 S Littler Dr E
- 252 S Mangrum Place
- 353 S Pin High Dr
- 390 W Archer Dr
- 438 W Fairway Dr
- 433 W Fairway Dr
- 408 S Birdie Dr
- 444 W Archer Dr
- 450 W Venturi Dr
- 450 W Pin High Dr
- 473 W Archer Dr
- 463 W Player Dr
- 429 S Soaring Eagle Dr
- 192 S Golfview Dr
- 152 W Glenrose Dr
- 314 S Casper Dr
- 314 S Casper Dr Unit 34
- 326 S Casper Dr
- 313 S Souchak Ct
- 286 W Hahns Peak Ave
- 304 W Casper Dr
- 321 S Casper Dr Unit 3
- 321 S Casper Dr
- 315 S Casper Dr
- 327 S Souchak Ct Unit 4
- 305 S Souchak Ct
- 287 W Archer Dr
- 310 W Hahns Peak Ave
- 330 S Souchak Ct
- 295 W Archer Dr
- 312 W Casper Dr
- 321 S Souchak Ct Unit 3
- 312 S Souchak Ct
- 317 W Casper Dr
- 320 S Souchak Ct Unit 7