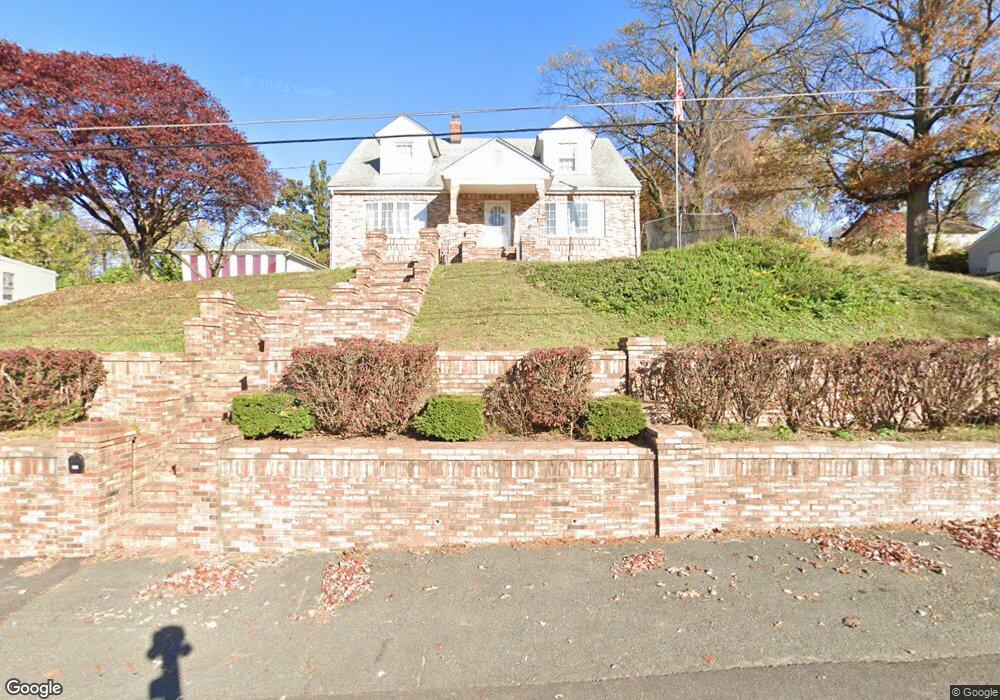
322 Second Ave Halethorpe, MD 21227
Lansdowne NeighborhoodEstimated Value: $410,000 - $440,000
Studio
2
Baths
2,058
Sq Ft
$206/Sq Ft
Est. Value
About This Home
This home is located at 322 Second Ave, Halethorpe, MD 21227 and is currently estimated at $424,040, approximately $206 per square foot. 322 Second Ave is a home located in Baltimore County with nearby schools including Lansdowne Elementary School, Lansdowne Middle School, and Lansdowne High School.
Ownership History
Date
Name
Owned For
Owner Type
Purchase Details
Closed on
Sep 7, 2021
Sold by
Latham John R and Dugan Jennifer Latham
Bought by
Mcfarlane Andrew
Current Estimated Value
Home Financials for this Owner
Home Financials are based on the most recent Mortgage that was taken out on this home.
Original Mortgage
$353,479
Outstanding Balance
$318,822
Interest Rate
2.8%
Mortgage Type
FHA
Estimated Equity
$105,218
Purchase Details
Closed on
May 26, 1981
Sold by
Ward Earl C
Bought by
Latham John R
Create a Home Valuation Report for This Property
The Home Valuation Report is an in-depth analysis detailing your home's value as well as a comparison with similar homes in the area
Home Values in the Area
Average Home Value in this Area
Purchase History
| Date | Buyer | Sale Price | Title Company |
|---|---|---|---|
| Mcfarlane Andrew | $365,000 | C & C Title | |
| Latham John R | $61,000 | -- |
Source: Public Records
Mortgage History
| Date | Status | Borrower | Loan Amount |
|---|---|---|---|
| Open | Mcfarlane Andrew | $353,479 |
Source: Public Records
Tax History
| Year | Tax Paid | Tax Assessment Tax Assessment Total Assessment is a certain percentage of the fair market value that is determined by local assessors to be the total taxable value of land and additions on the property. | Land | Improvement |
|---|---|---|---|---|
| 2025 | $4,934 | $349,800 | -- | -- |
| 2024 | $4,934 | $317,700 | $65,500 | $252,200 |
| 2023 | $5,052 | $298,233 | $0 | $0 |
| 2022 | $4,116 | $278,767 | $0 | $0 |
| 2020 | $3,143 | $259,300 | $65,500 | $193,800 |
| 2019 | $3,143 | $259,300 | $65,500 | $193,800 |
| 2018 | $3,731 | $260,200 | $65,500 | $194,700 |
| 2017 | $3,508 | $248,967 | $0 | $0 |
| 2016 | -- | $237,733 | $0 | $0 |
| 2015 | $3,360 | $226,500 | $0 | $0 |
| 2014 | $3,360 | $226,500 | $0 | $0 |
Source: Public Records
Map
Nearby Homes
- 401 2nd Ave
- 413 1st Ave
- 302 4th Ave
- 418 1st Ave
- 216 Clyde Ave
- 238 Elizabeth Ave
- 108 4th Ave
- 0 Hammonds Ferry Rd
- 4157 Hollins Ferry Rd
- 3504 Shenandoah Ave
- 211 Green Fern Way
- 104 Ridge Ave
- 3207 Janice Ave
- 0 Monumental Ave Unit MDBC2082542
- 3202 Garden Ave
- 3008 Huron St
- 4438 Scotia Rd
- 2707 Marbourne Ave
- 4435 Scotia Rd
- 4448 Fenor Rd
Your Personal Tour Guide
Ask me questions while you tour the home.