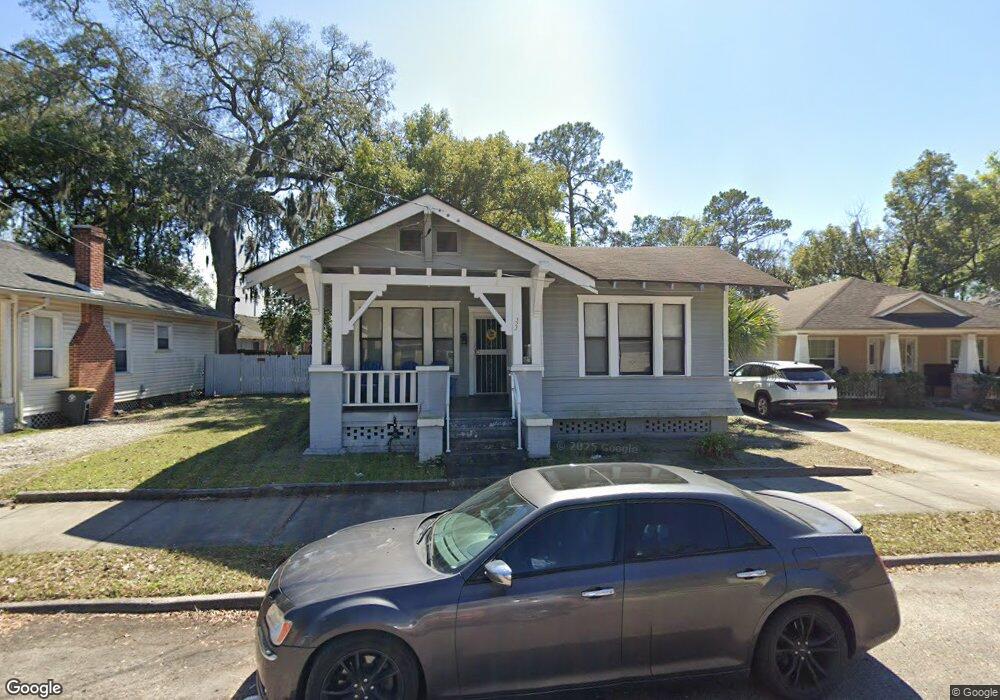
322 W 22nd St Jacksonville, FL 32206
Brentwood NeighborhoodEstimated Value: $72,000 - $136,000
3
Beds
1
Bath
1,082
Sq Ft
$93/Sq Ft
Est. Value
About This Home
This home is located at 322 W 22nd St, Jacksonville, FL 32206 and is currently estimated at $100,701, approximately $93 per square foot. 322 W 22nd St is a home located in Duval County with nearby schools including North Shore Elementary School, Matthew W. Gilbert Middle School, and Jean Ribault High School.
Ownership History
Date
Name
Owned For
Owner Type
Purchase Details
Closed on
Feb 28, 2020
Sold by
St Zita Operations Llc
Bought by
Land Trust Service Corporation
Current Estimated Value
Purchase Details
Closed on
Jan 3, 2020
Sold by
Hollis Robbie
Bought by
St Zita Operations Llc
Purchase Details
Closed on
Jun 7, 2010
Sold by
Glover Cynthia D
Bought by
Bac Home Loan Servicing L P
Purchase Details
Closed on
May 17, 1996
Sold by
Chapman Hubert W and Chapman Nancy L
Bought by
Marks L H
Create a Home Valuation Report for This Property
The Home Valuation Report is an in-depth analysis detailing your home's value as well as a comparison with similar homes in the area
Home Values in the Area
Average Home Value in this Area
Purchase History
| Date | Buyer | Sale Price | Title Company |
|---|---|---|---|
| Land Trust Service Corporation | -- | None Available | |
| St Zita Operations Llc | $24,000 | All Florida Title Svcs Inc | |
| Bac Home Loan Servicing L P | -- | Attorney | |
| Marks L H | $17,000 | -- |
Source: Public Records
Tax History Compared to Growth
Tax History
| Year | Tax Paid | Tax Assessment Tax Assessment Total Assessment is a certain percentage of the fair market value that is determined by local assessors to be the total taxable value of land and additions on the property. | Land | Improvement |
|---|---|---|---|---|
| 2025 | $802 | $32,111 | -- | -- |
| 2024 | $767 | $40,092 | $14,018 | $26,074 |
| 2023 | $767 | $38,805 | $12,238 | $26,567 |
| 2022 | $654 | $29,898 | $5,340 | $24,558 |
| 2021 | $596 | $21,934 | $4,005 | $17,929 |
| 2020 | $781 | $32,753 | $4,895 | $27,858 |
| 2019 | $733 | $29,176 | $4,895 | $24,281 |
| 2018 | $728 | $28,623 | $4,895 | $23,728 |
| 2017 | $719 | $27,794 | $4,450 | $23,344 |
| 2016 | $702 | $26,403 | $0 | $0 |
| 2015 | $682 | $24,893 | $0 | $0 |
| 2014 | $212 | $20,601 | $0 | $0 |
Source: Public Records
Map
Nearby Homes