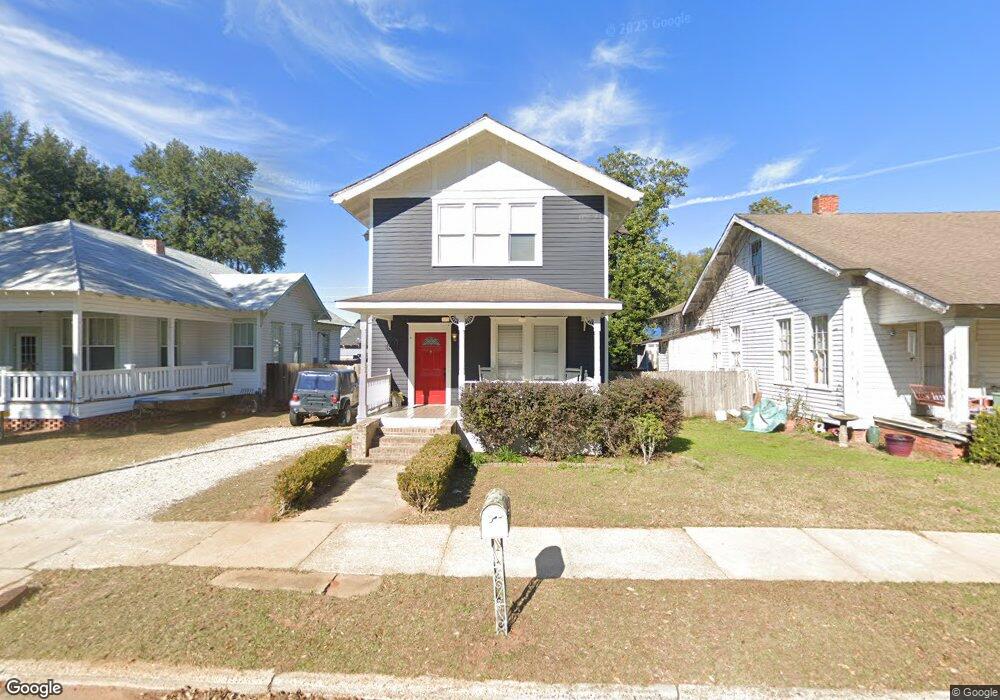
322 W Broughton St Bainbridge, GA 39817
Estimated Value: $197,590 - $237,000
--
Bed
1
Bath
2,040
Sq Ft
$108/Sq Ft
Est. Value
About This Home
This home is located at 322 W Broughton St, Bainbridge, GA 39817 and is currently estimated at $219,398, approximately $107 per square foot. 322 W Broughton St is a home located in Decatur County with nearby schools including Bainbridge High School and Grace Christian Academy.
Ownership History
Date
Name
Owned For
Owner Type
Purchase Details
Closed on
Jan 21, 2011
Sold by
Federal Home Loan Mortgage Corporation
Bought by
Miller Willis Bank and Miller Lesley Brannen
Current Estimated Value
Home Financials for this Owner
Home Financials are based on the most recent Mortgage that was taken out on this home.
Original Mortgage
$68,303
Interest Rate
4.79%
Mortgage Type
Purchase Money Mortgage
Purchase Details
Closed on
Oct 5, 2010
Sold by
Wells Fargo Bank Na
Bought by
Federal Home Loan Mortgage Corp
Purchase Details
Closed on
Jul 16, 2007
Sold by
Miller Michael L
Bought by
Lane Wendy D and Lane Matthew H
Home Financials for this Owner
Home Financials are based on the most recent Mortgage that was taken out on this home.
Original Mortgage
$123,500
Interest Rate
6.71%
Mortgage Type
New Conventional
Create a Home Valuation Report for This Property
The Home Valuation Report is an in-depth analysis detailing your home's value as well as a comparison with similar homes in the area
Home Values in the Area
Average Home Value in this Area
Purchase History
| Date | Buyer | Sale Price | Title Company |
|---|---|---|---|
| Miller Willis Bank | -- | -- | |
| Federal Home Loan Mortgage Corp | $116,500 | -- | |
| Wells Fargo Bank Na | $116,500 | -- | |
| Lane Wendy D | $130,000 | -- |
Source: Public Records
Mortgage History
| Date | Status | Borrower | Loan Amount |
|---|---|---|---|
| Closed | Miller Willis Bank | $68,303 | |
| Previous Owner | Lane Wendy D | $123,500 |
Source: Public Records
Tax History Compared to Growth
Tax History
| Year | Tax Paid | Tax Assessment Tax Assessment Total Assessment is a certain percentage of the fair market value that is determined by local assessors to be the total taxable value of land and additions on the property. | Land | Improvement |
|---|---|---|---|---|
| 2024 | $2,008 | $65,306 | $8,000 | $57,306 |
| 2023 | $1,433 | $62,674 | $8,000 | $54,674 |
| 2022 | $1,878 | $62,650 | $8,000 | $54,650 |
| 2021 | $1,682 | $54,880 | $8,000 | $46,880 |
| 2020 | $1,492 | $46,376 | $8,000 | $38,376 |
| 2019 | $1,415 | $42,502 | $8,000 | $34,502 |
| 2018 | $1,460 | $42,502 | $8,000 | $34,502 |
| 2017 | $1,380 | $39,458 | $8,000 | $31,458 |
| 2016 | $1,380 | $39,458 | $8,000 | $31,458 |
| 2015 | $1,419 | $39,458 | $8,000 | $31,458 |
| 2014 | $1,315 | $39,458 | $8,000 | $31,458 |
| 2013 | -- | $39,458 | $8,000 | $31,458 |
Source: Public Records
Map
Nearby Homes
- 306 S Broad St
- 302 E Water St
- 249 Meredith Dr
- 245 Meredith Dr
- Lot 3 Mountain View Way
- 0000 Mountain View Way
- Lot 8 Mountain View Way
- 210 W Evans St
- 415 Charles St
- 414 S Broad St
- 418 E Broughton St
- 423 E Shotwell St
- 309 E Evans St
- 435 E Broughton St
- 409 E Evans St
- 502 Planter St
- Dell Rd
- 411 Independent St
- 632 E Shotwell St
- 640 E Shotwell St
- 318 W Broughton St
- 328 W Broughton St
- 323 W Water St
- 332 W Broughton St
- 329 W Water St
- 105 Florida St
- 331 W Water St
- 317 W Broughton St
- 331 E Broughton St
- 107 N Donalson St
- 101 N Donalson St
- 163 N Donalson St
- 326 W Water St
- 324 W Water St
- 111 N Donalson St
- 314 W Troupe St
- 306 W Water St
- 112 Florida St
- 201 N Donalson St
- 220 W Broughton St