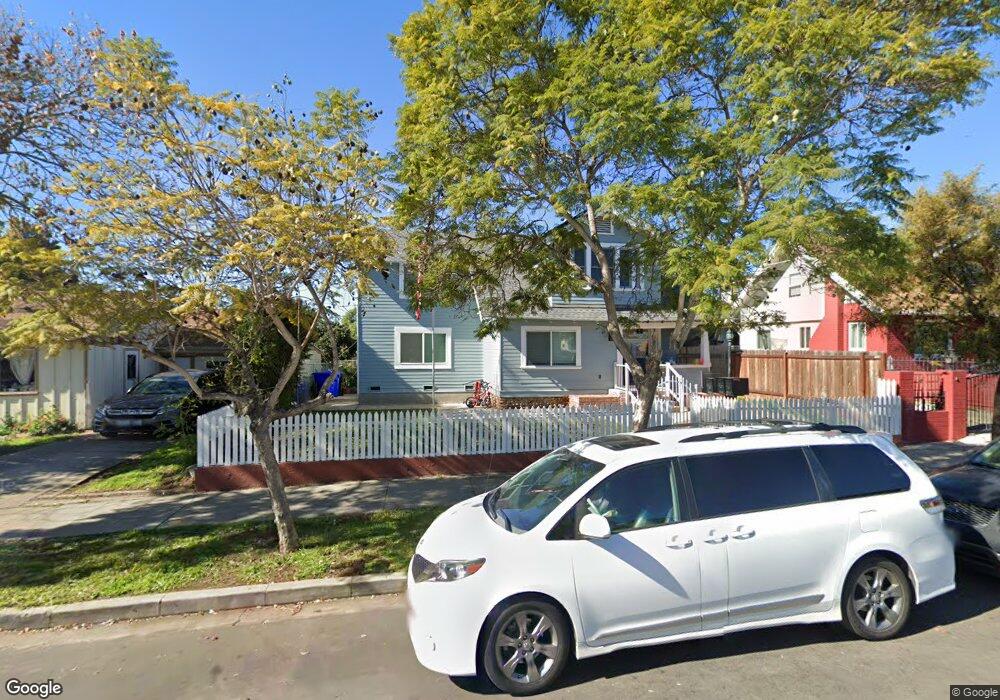
3220 41st St San Diego, CA 92105
Castle NeighborhoodEstimated Value: $750,000 - $849,000
4
Beds
2
Baths
1,888
Sq Ft
$434/Sq Ft
Est. Value
About This Home
This home is located at 3220 41st St, San Diego, CA 92105 and is currently estimated at $820,002, approximately $434 per square foot. 3220 41st St is a home located in San Diego County with nearby schools including Joyner Elementary School, Clark Middle School, and Herbert Hoover High School.
Ownership History
Date
Name
Owned For
Owner Type
Purchase Details
Closed on
Dec 31, 2012
Sold by
Huerta Patricia G
Bought by
Huerta Patricia G
Current Estimated Value
Home Financials for this Owner
Home Financials are based on the most recent Mortgage that was taken out on this home.
Original Mortgage
$30,000
Outstanding Balance
$21,453
Interest Rate
3.99%
Mortgage Type
Credit Line Revolving
Estimated Equity
$798,549
Purchase Details
Closed on
Feb 6, 2003
Sold by
Huerta Patricia G
Bought by
Huerta Patricia G
Home Financials for this Owner
Home Financials are based on the most recent Mortgage that was taken out on this home.
Original Mortgage
$85,000
Interest Rate
5.24%
Purchase Details
Closed on
Jan 11, 1997
Sold by
Huerta Guadalupe J Trust 11-29-93 and Huerta Patricia
Bought by
Huerta Patricia G
Purchase Details
Closed on
Nov 29, 1993
Sold by
Huerta Guadalupe Jimenez
Bought by
Huerta Guadalupe Jimenez
Create a Home Valuation Report for This Property
The Home Valuation Report is an in-depth analysis detailing your home's value as well as a comparison with similar homes in the area
Home Values in the Area
Average Home Value in this Area
Purchase History
| Date | Buyer | Sale Price | Title Company |
|---|---|---|---|
| Huerta Patricia G | -- | Fidelity National Title Co | |
| Huerta Patricia G | -- | Stewart Title | |
| Huerta Patricia G | -- | -- | |
| Huerta Guadalupe Jimenez | -- | -- |
Source: Public Records
Mortgage History
| Date | Status | Borrower | Loan Amount |
|---|---|---|---|
| Open | Huerta Patricia G | $30,000 | |
| Open | Huerta Patricia G | $85,000 | |
| Closed | Huerta Patricia G | $85,000 |
Source: Public Records
Tax History Compared to Growth
Tax History
| Year | Tax Paid | Tax Assessment Tax Assessment Total Assessment is a certain percentage of the fair market value that is determined by local assessors to be the total taxable value of land and additions on the property. | Land | Improvement |
|---|---|---|---|---|
| 2025 | $1,002 | $87,462 | $23,299 | $64,163 |
| 2024 | $1,002 | $85,748 | $22,843 | $62,905 |
| 2023 | $978 | $84,068 | $22,396 | $61,672 |
| 2022 | $950 | $82,420 | $21,957 | $60,463 |
| 2021 | $942 | $80,805 | $21,527 | $59,278 |
| 2020 | $930 | $79,978 | $21,307 | $58,671 |
| 2019 | $913 | $78,411 | $20,890 | $57,521 |
| 2018 | $853 | $76,875 | $20,481 | $56,394 |
| 2017 | $831 | $75,369 | $20,080 | $55,289 |
| 2016 | $815 | $73,892 | $19,687 | $54,205 |
| 2015 | $802 | $72,783 | $19,392 | $53,391 |
| 2014 | $789 | $71,359 | $19,013 | $52,346 |
Source: Public Records
Map
Nearby Homes
- 4128 Thorn St
- 0 42nd Unit PTP2505266
- 3083 39th St
- 3450 42nd St
- 2931 Dahlia St Unit 12
- 4600 Myrtle Ave
- 3448-50 Cherokee Ave
- 2537 Tuberose St
- 4183 Sycamore Dr
- 3005 Vancouver Ave
- 3565 Highland Ave Unit 5
- 3571 Highland Ave
- 3655 44th St
- 3815 42nd St
- 3833-39 N 42nd St
- 3421 Vancouver Ave
- 3622 Landis St
- 3728 Cherokee Ave
- 3825 Van Dyke Ave
- 3694 36th St
- 3226 41st St
- 3212 41st St
- 3206 41st St
- 4085 Thorn St
- 3240 41st St
- 3146 41st St
- 3215 Central Ave Unit 17
- 3227 Central Ave
- 4095 Thorn St
- 3209 Central Ave Unit 11
- 3203 Central Ave
- 4065 Thorn St
- 3138 41st St
- 3235 Central Ave
- 3219 41st St Unit 21
- 3223 41st St
- 3141 Central Ave Unit 43
- 4103 Thorn St
- 3229 41st St
- 3211 41st St