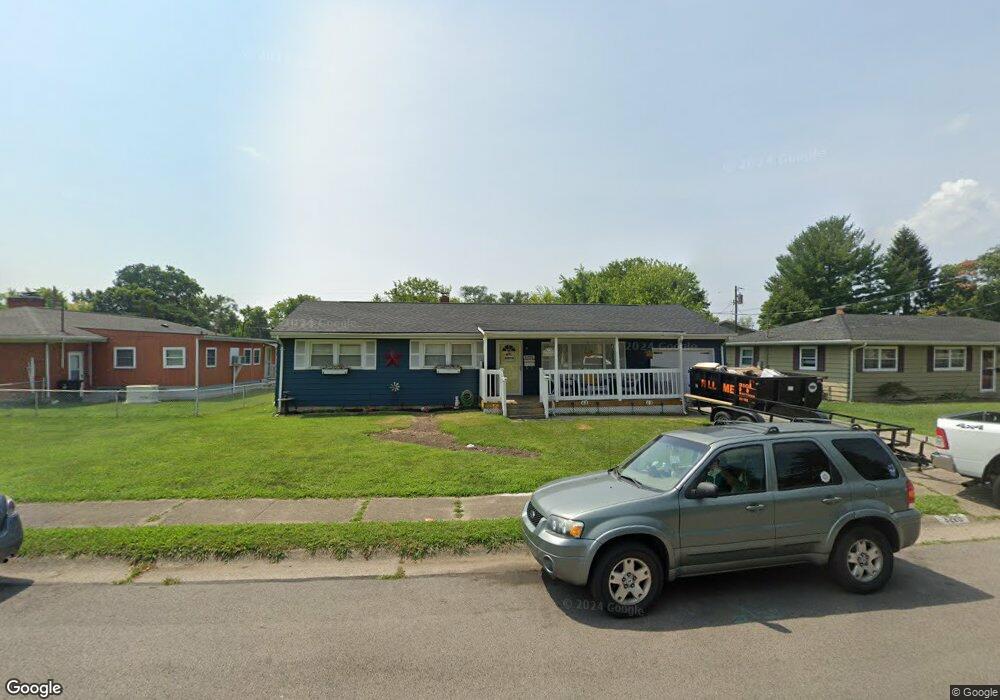
3220 Goldman Ave Middletown, OH 45044
Barbara Park NeighborhoodEstimated Value: $167,000 - $218,000
3
Beds
1
Bath
1,144
Sq Ft
$161/Sq Ft
Est. Value
About This Home
This home is located at 3220 Goldman Ave, Middletown, OH 45044 and is currently estimated at $184,448, approximately $161 per square foot. 3220 Goldman Ave is a home located in Butler County with nearby schools including Mayfield Elementary School, Highview 6th Grade Center, and Middletown Middle School.
Ownership History
Date
Name
Owned For
Owner Type
Purchase Details
Closed on
May 10, 2021
Sold by
Foster Gary D and Foster Cora J
Bought by
Gfoster Rental Llc
Current Estimated Value
Purchase Details
Closed on
Jan 23, 2015
Sold by
Foster Gary D and Foster Cora J
Bought by
Foster Gary D and Foster Cora J
Purchase Details
Closed on
Aug 25, 2009
Sold by
Baker Derek R and Baker Amy
Bought by
Foster Gary D and Foster Cora J
Purchase Details
Closed on
Apr 29, 2009
Sold by
Baker Amy
Bought by
Baker Derek R
Purchase Details
Closed on
Nov 26, 2007
Sold by
Stokely Reniva
Bought by
Baker Derek R and Baker Amy
Home Financials for this Owner
Home Financials are based on the most recent Mortgage that was taken out on this home.
Original Mortgage
$98,500
Interest Rate
6.47%
Mortgage Type
Purchase Money Mortgage
Purchase Details
Closed on
Oct 31, 1997
Sold by
Keller Shirley A
Bought by
Stokely Reniva
Create a Home Valuation Report for This Property
The Home Valuation Report is an in-depth analysis detailing your home's value as well as a comparison with similar homes in the area
Home Values in the Area
Average Home Value in this Area
Purchase History
| Date | Buyer | Sale Price | Title Company |
|---|---|---|---|
| Gfoster Rental Llc | -- | None Available | |
| Foster Gary D | -- | Attorney | |
| Foster Gary D | $60,000 | Attorney | |
| Baker Derek R | -- | Attorney | |
| Baker Derek R | $98,500 | Attorney | |
| Stokely Reniva | $78,000 | -- |
Source: Public Records
Mortgage History
| Date | Status | Borrower | Loan Amount |
|---|---|---|---|
| Previous Owner | Baker Derek R | $98,500 |
Source: Public Records
Tax History
| Year | Tax Paid | Tax Assessment Tax Assessment Total Assessment is a certain percentage of the fair market value that is determined by local assessors to be the total taxable value of land and additions on the property. | Land | Improvement |
|---|---|---|---|---|
| 2025 | $2,741 | $51,410 | $7,460 | $43,950 |
| 2024 | $2,741 | $51,410 | $7,460 | $43,950 |
| 2023 | $2,708 | $48,020 | $7,460 | $40,560 |
| 2022 | $2,156 | $36,290 | $7,460 | $28,830 |
| 2021 | $2,082 | $36,290 | $7,460 | $28,830 |
| 2020 | $2,169 | $36,290 | $7,460 | $28,830 |
| 2019 | $1,502 | $20,720 | $7,820 | $12,900 |
| 2018 | $1,342 | $20,720 | $7,820 | $12,900 |
| 2017 | $1,344 | $20,720 | $7,820 | $12,900 |
| 2016 | $1,230 | $18,150 | $7,820 | $10,330 |
| 2015 | $1,212 | $18,150 | $7,820 | $10,330 |
| 2014 | $1,290 | $18,150 | $7,820 | $10,330 |
| 2013 | $1,290 | $21,000 | $7,820 | $13,180 |
Source: Public Records
Map
Nearby Homes
- 3216 Beatrice Dr
- 3208 Beatrice Dr
- 3213 Selden Ave
- 1706 Park Dr
- 1315 Brentwood St
- 1932 Winton St
- 3700 Greenwood Dr
- 1913 Brentwood St
- 2013 Lamberton St
- 2028 Jackson Ln
- 1305 Highland St
- 529 Kensington St
- 2128 Lamberton St
- 3746 Lacy Ct
- 3504 Brian Ct
- 808 The Alameda
- 602 Ross St
- 500 Florence St
- 503 Gladys Dr
- 1205 Eaton Ave
- 3216 Goldman Ave
- 1600 Kensington St
- 1620 Kensington St
- 1612 Kensington St
- 1624 Kensington St
- 3221 Goldman Ave
- 1628 Kensington St
- 3213 Goldman Ave
- 1630 Kensington St
- 3209 Goldman Ave
- 1632 Kensington St
- 3208 Goldman Ave
- 1601 Kensington St
- 1634 Kensington St
- 1504 Kensington St
- 3205 Goldman Ave
- 3219 Beatrice Dr
- 1625 Kensington St
- 1603 Kensington St
- 1623 Kensington St
Your Personal Tour Guide
Ask me questions while you tour the home.