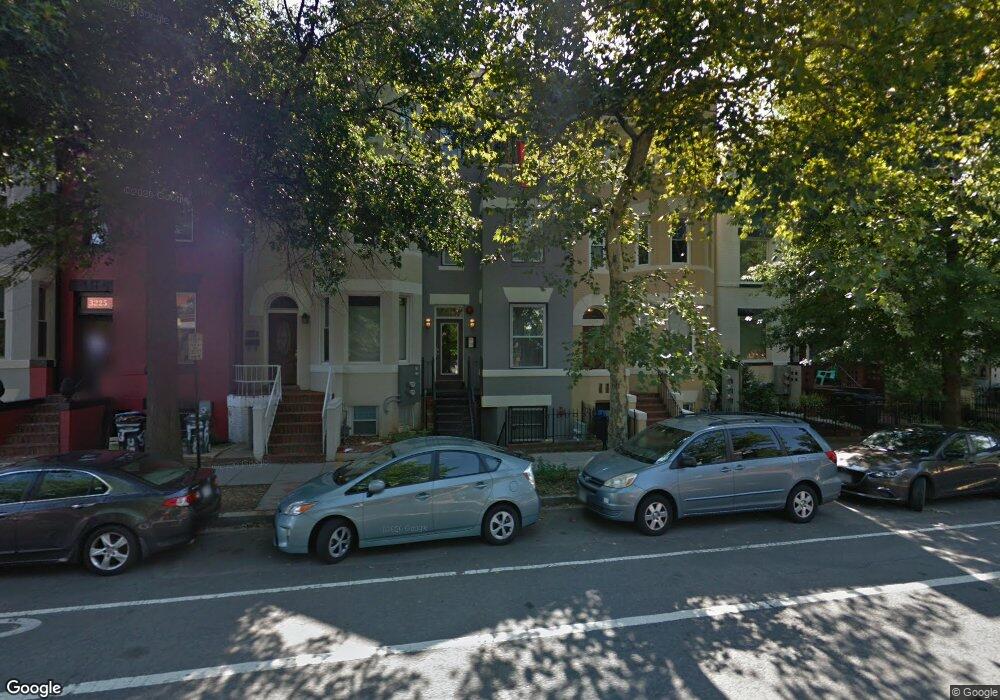
3221 11th St NW Washington, DC 20010
Columbia Heights NeighborhoodEstimated Value: $649,000 - $751,000
2
Beds
3
Baths
1,155
Sq Ft
$604/Sq Ft
Est. Value
About This Home
This home is located at 3221 11th St NW, Washington, DC 20010 and is currently estimated at $697,078, approximately $603 per square foot. 3221 11th St NW is a home located in District of Columbia with nearby schools including Tubman Elementary School, Columbia Heights Education Campus, and Cardozo Education Campus.
Ownership History
Date
Name
Owned For
Owner Type
Purchase Details
Closed on
May 15, 2018
Sold by
Richie Celeste J and Arrol Jason I
Bought by
Simmons Virginia Lennox
Current Estimated Value
Home Financials for this Owner
Home Financials are based on the most recent Mortgage that was taken out on this home.
Original Mortgage
$629,910
Outstanding Balance
$541,208
Interest Rate
4.4%
Mortgage Type
New Conventional
Estimated Equity
$155,870
Purchase Details
Closed on
Aug 31, 2016
Sold by
Lafargue Christopher J and Zahner Luke V
Bought by
Richie Celeste J and Arrol Jason I
Home Financials for this Owner
Home Financials are based on the most recent Mortgage that was taken out on this home.
Original Mortgage
$531,250
Interest Rate
3.44%
Mortgage Type
New Conventional
Purchase Details
Closed on
Mar 1, 2004
Sold by
3221 Eleventh Street Llc
Bought by
Zahner Luke and La Fargue,Christopher J
Home Financials for this Owner
Home Financials are based on the most recent Mortgage that was taken out on this home.
Original Mortgage
$340,000
Interest Rate
5.62%
Mortgage Type
New Conventional
Create a Home Valuation Report for This Property
The Home Valuation Report is an in-depth analysis detailing your home's value as well as a comparison with similar homes in the area
Home Values in the Area
Average Home Value in this Area
Purchase History
| Date | Buyer | Sale Price | Title Company |
|---|---|---|---|
| Simmons Virginia Lennox | $699,900 | Attorney | |
| Richie Celeste J | $625,000 | Title Town Settlements Llc | |
| Zahner Luke | $425,000 | -- |
Source: Public Records
Mortgage History
| Date | Status | Borrower | Loan Amount |
|---|---|---|---|
| Open | Simmons Virginia Lennox | $629,910 | |
| Previous Owner | Richie Celeste J | $531,250 | |
| Previous Owner | Zahner Luke | $340,000 |
Source: Public Records
Tax History Compared to Growth
Tax History
| Year | Tax Paid | Tax Assessment Tax Assessment Total Assessment is a certain percentage of the fair market value that is determined by local assessors to be the total taxable value of land and additions on the property. | Land | Improvement |
|---|---|---|---|---|
| 2025 | $5,262 | $724,540 | $217,360 | $507,180 |
| 2024 | $5,291 | $724,720 | $217,420 | $507,300 |
| 2023 | $5,180 | $708,100 | $212,430 | $495,670 |
| 2022 | $5,173 | $701,050 | $210,310 | $490,740 |
| 2021 | $5,252 | $707,560 | $212,270 | $495,290 |
| 2020 | $5,213 | $688,960 | $206,690 | $482,270 |
| 2019 | $4,874 | $648,240 | $194,470 | $453,770 |
| 2018 | $4,948 | $655,480 | $0 | $0 |
| 2017 | $4,788 | $635,710 | $0 | $0 |
| 2016 | $5,333 | $627,440 | $0 | $0 |
| 2015 | $5,416 | $637,160 | $0 | $0 |
| 2014 | -- | $574,120 | $0 | $0 |
Source: Public Records
Map
Nearby Homes
- 3318 Sherman Ave NW Unit 101
- 3318 Sherman Ave NW Unit 104
- 3303 Sherman Ave NW Unit B
- 3303 Sherman Ave NW Unit A
- 1249 Kenyon St NW Unit 4
- 1126 Park Rd NW
- 776 Lamont St NW
- 1212 Park Rd NW
- 3101 Sherman Ave NW Unit 402
- 3311 13th St NW Unit 5
- 3030 Sherman Ave NW
- 1204 Irving St NW
- 3222 13th St NW Unit 2
- 1305 Kenyon St NW
- 755 Irving St NW
- 729 Kenyon St NW
- 3409 Sherman Ave NW Unit 2
- 3007 11th St NW
- 3404 13th St NW Unit 102
- 1021 Columbia Rd NW
- 3221 11th St NW
- 3221 11th St NW
- 3221 11th St NW
- 3221 11th St NW
- 3221 11th St NW Unit 300
- 3221 11th St NW Unit 100
- 3221 11th St NW Unit 1
- 3223 11th St NW
- 3219 11th St NW Unit 2B
- 3219 11th St NW Unit 2D
- 3219 11th St NW
- 3219 11th St NW Unit 1
- 3219 11th St NW
- 3219 11th St NW Unit TWO
- 3219 11th St NW Unit 2
- 3225 11th St NW
- 3217 11th St NW
- 3227 11th St NW Unit 4D
- 3227 11th St NW
- 3215 11th St NW