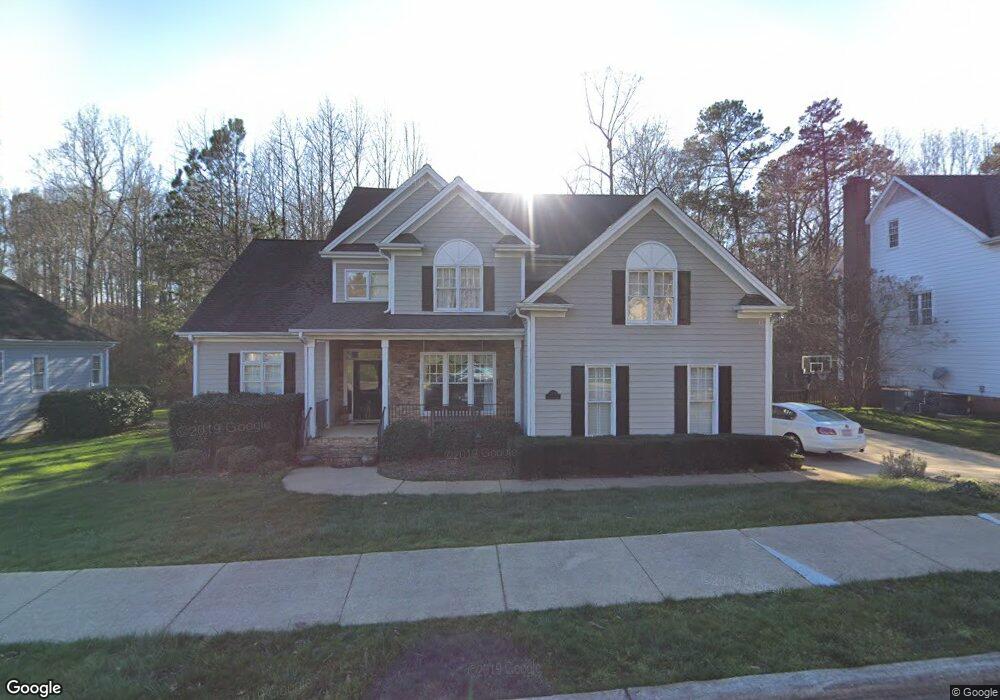
3221 Belspring Ln Raleigh, NC 27612
Umstead NeighborhoodEstimated Value: $910,000 - $1,028,000
5
Beds
3
Baths
3,586
Sq Ft
$272/Sq Ft
Est. Value
About This Home
This home is located at 3221 Belspring Ln, Raleigh, NC 27612 and is currently estimated at $974,827, approximately $271 per square foot. 3221 Belspring Ln is a home located in Wake County with nearby schools including Stough Elementary School, Oberlin Middle School, and Broughton Magnet High School.
Ownership History
Date
Name
Owned For
Owner Type
Purchase Details
Closed on
Jan 27, 2022
Sold by
Pancoast Geoffrey N
Bought by
Pancoast Geoffrey N and Pancoast Iryn R
Current Estimated Value
Home Financials for this Owner
Home Financials are based on the most recent Mortgage that was taken out on this home.
Original Mortgage
$541,000
Outstanding Balance
$510,457
Interest Rate
5%
Mortgage Type
New Conventional
Estimated Equity
$464,370
Purchase Details
Closed on
Apr 26, 2017
Sold by
English John A and English Hope C
Bought by
Pancoast Geoffrey N
Home Financials for this Owner
Home Financials are based on the most recent Mortgage that was taken out on this home.
Original Mortgage
$424,000
Interest Rate
4.3%
Mortgage Type
New Conventional
Purchase Details
Closed on
Mar 15, 2007
Sold by
Bergeman Richard W and Bergeman Patricia A
Bought by
English John A and English Hope C
Home Financials for this Owner
Home Financials are based on the most recent Mortgage that was taken out on this home.
Original Mortgage
$386,400
Interest Rate
5.5%
Mortgage Type
Purchase Money Mortgage
Create a Home Valuation Report for This Property
The Home Valuation Report is an in-depth analysis detailing your home's value as well as a comparison with similar homes in the area
Home Values in the Area
Average Home Value in this Area
Purchase History
| Date | Buyer | Sale Price | Title Company |
|---|---|---|---|
| Pancoast Geoffrey N | -- | Kelso Lloyd T | |
| Pancoast Geoffrey N | -- | None Listed On Document | |
| Pancoast Geoffrey N | $530,000 | None Available | |
| English John A | $483,000 | None Available |
Source: Public Records
Mortgage History
| Date | Status | Borrower | Loan Amount |
|---|---|---|---|
| Open | Pancoast Geoffrey N | $541,000 | |
| Previous Owner | Pancoast Geoffrey N | $424,000 | |
| Previous Owner | English John A | $386,400 |
Source: Public Records
Tax History Compared to Growth
Tax History
| Year | Tax Paid | Tax Assessment Tax Assessment Total Assessment is a certain percentage of the fair market value that is determined by local assessors to be the total taxable value of land and additions on the property. | Land | Improvement |
|---|---|---|---|---|
| 2025 | $8,000 | $915,026 | $225,000 | $690,026 |
| 2024 | $7,967 | $915,026 | $225,000 | $690,026 |
| 2023 | $6,150 | $562,348 | $120,000 | $442,348 |
| 2022 | $5,714 | $562,348 | $120,000 | $442,348 |
| 2021 | $5,492 | $562,348 | $120,000 | $442,348 |
| 2020 | $5,392 | $562,348 | $120,000 | $442,348 |
| 2019 | $5,673 | $487,809 | $120,000 | $367,809 |
| 2018 | $5,350 | $487,809 | $120,000 | $367,809 |
| 2017 | $5,095 | $487,809 | $120,000 | $367,809 |
| 2016 | $4,990 | $487,809 | $120,000 | $367,809 |
| 2015 | $5,320 | $511,799 | $140,000 | $371,799 |
| 2014 | $5,045 | $511,799 | $140,000 | $371,799 |
Source: Public Records
Map
Nearby Homes
- 2904 Stone Gap Ct
- 3634 Mill Run Unit 20
- 3559 Mill Run Unit 45
- 3213 Mill Run Unit 174
- 3561 Mill Run
- 3291 Mill Run Unit 149
- 3417 Sir Colleton Ct
- 3421 Barron Berkeley Way
- 3847 Stoneridge Forest Dr
- 4216 MacOn Pond Rd
- 3701 Baron Cooper Pass Unit 303
- 3700 Baron Cooper Pass Unit 302
- 3111 Hemlock Forest Cir Unit 303
- 4016 Edward Pride Wynd
- 4646 Fawnbrook Cir
- 4110 Sedgewood Dr Unit 302
- 3119 Kentish Town Ln
- 4617 Fawnbrook Cir
- 4601 Timbermill Ct Unit 303
- 4601 Timbermill Ct Unit 302
- 3209 Belspring Ln
- 3225 Belspring Ln
- 4625 Grenadine Ct
- 3201 Belspring Ln
- 3200 Belspring Ln
- 3301 Belspring Ln
- 4621 Grenadine Ct
- 3119 Belspring Ln
- 2805 Stone Gap Ct
- 3305 Belspring Ln
- 4624 Grenadine Ct
- 4617 Grenadine Ct
- 2800 Stone Gap Ct
- 2809 Stone Gap Ct
- 3308 Belspring Ln
- 3309 Belspring Ln
- 3724 Bridgeton Park Dr
- 4613 Grenadine Ct
- 3108 Belspring Ln
- 3109 Belspring Ln