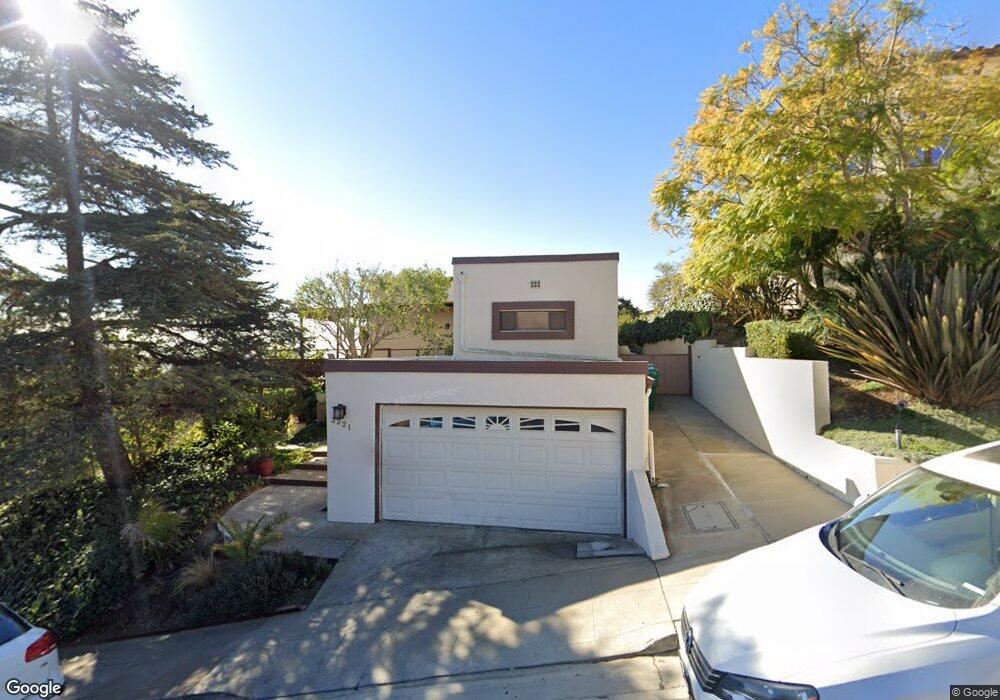
3221 Lucinda St San Diego, CA 92106
La Playa NeighborhoodEstimated Value: $1,832,000 - $2,231,000
2
Beds
2
Baths
1,700
Sq Ft
$1,185/Sq Ft
Est. Value
About This Home
This home is located at 3221 Lucinda St, San Diego, CA 92106 and is currently estimated at $2,013,724, approximately $1,184 per square foot. 3221 Lucinda St is a home located in San Diego County with nearby schools including Cabrillo Elementary School, Richard Henry Dana Middle School, and Correia Middle School.
Ownership History
Date
Name
Owned For
Owner Type
Purchase Details
Closed on
May 24, 2021
Sold by
Dobyns Mary A and The Louis And Mary Dobyns Fami
Bought by
Donnelly Kenneth W and Donnelly Christy Crawford
Current Estimated Value
Home Financials for this Owner
Home Financials are based on the most recent Mortgage that was taken out on this home.
Original Mortgage
$750,000
Outstanding Balance
$678,625
Interest Rate
3%
Mortgage Type
New Conventional
Estimated Equity
$1,335,099
Purchase Details
Closed on
Jan 8, 2021
Sold by
Morrison Warren Gervaise
Bought by
Morrison Family Trust and Dobyns
Purchase Details
Closed on
Jan 6, 2021
Sold by
Dobyns Mary A
Bought by
Dobyns Mary A and Dobyns Mary A
Purchase Details
Closed on
Jul 31, 2015
Sold by
Morrison Iris M
Bought by
Morrison Iris M
Purchase Details
Closed on
Jun 22, 2004
Sold by
Morrison Iris Matilda
Bought by
Morrison Iris Matilda
Purchase Details
Closed on
Apr 1, 1997
Sold by
Morrison Warren G
Bought by
Morrison Iris Matilda
Create a Home Valuation Report for This Property
The Home Valuation Report is an in-depth analysis detailing your home's value as well as a comparison with similar homes in the area
Home Values in the Area
Average Home Value in this Area
Purchase History
| Date | Buyer | Sale Price | Title Company |
|---|---|---|---|
| Donnelly Kenneth W | $1,612,500 | First Amer Ttl Co San Diego | |
| Morrison Family Trust | -- | -- | |
| Dobyns Mary A | -- | First American Title Company | |
| Dobyns Mary A | -- | First American Title Company | |
| Morrison Iris M | -- | None Available | |
| Morrison Iris Matilda | -- | -- | |
| Morrison Iris Matilda | -- | -- |
Source: Public Records
Mortgage History
| Date | Status | Borrower | Loan Amount |
|---|---|---|---|
| Open | Donnelly Kenneth W | $750,000 |
Source: Public Records
Tax History Compared to Growth
Tax History
| Year | Tax Paid | Tax Assessment Tax Assessment Total Assessment is a certain percentage of the fair market value that is determined by local assessors to be the total taxable value of land and additions on the property. | Land | Improvement |
|---|---|---|---|---|
| 2025 | $21,049 | $1,745,420 | $1,596,586 | $148,834 |
| 2024 | $21,049 | $1,711,197 | $1,565,281 | $145,916 |
| 2023 | $20,586 | $1,677,645 | $1,534,590 | $143,055 |
| 2022 | $20,039 | $1,644,750 | $1,504,500 | $140,250 |
| 2021 | $1,837 | $146,408 | $104,135 | $42,273 |
| 2020 | $1,815 | $144,908 | $103,068 | $41,840 |
| 2019 | $1,783 | $142,068 | $101,048 | $41,020 |
| 2018 | $1,668 | $139,283 | $99,067 | $40,216 |
| 2017 | $1,629 | $136,553 | $97,125 | $39,428 |
| 2016 | $1,602 | $133,876 | $95,221 | $38,655 |
| 2015 | $1,578 | $131,866 | $93,791 | $38,075 |
| 2014 | $1,555 | $129,284 | $91,954 | $37,330 |
Source: Public Records
Map
Nearby Homes
- 885 Rosecrans St
- 3276 Talbot St
- 936 Armada Terrace
- 936 Bangor St
- 952 Rosecrans St
- 3016 Rogers St
- 3301 Trumbull St
- 1021 Scott St Unit 225
- 1021 Scott St Unit 256
- 1021 Scott St Unit 122
- 1021 Scott St Unit 103
- 1021 Scott St Unit 130
- 1021 Scott St Unit 218
- 3034-50 Canon St
- 1161 Akron St
- 617 Gage Dr
- 3130 Avenida de Portugal
- 3130 Avenida de Portugal Unit 305
- 567 Gage Ln
- 1268-74 Locust St
- 3233 Lucinda St
- 840 Armada Terrace
- 3235 Lucinda St
- 854 Harbor View Place
- 832 Armada Terrace
- 3245 Lucinda St
- 3208 Lucinda St
- 824 Armada Terrace
- 845 Armada Terrace
- 829 Armada Terrace
- 835 Armada Terrace
- 3236 Lucinda St
- 837 Golden Park Ave
- 835 Golden Park Ave
- 845 Golden Park Ave
- 3261 Lucinda St
- 855 Golden Park Ave
- 3242 Lucinda St
- 825 Harbor View Place
- 874 Harbor View Place