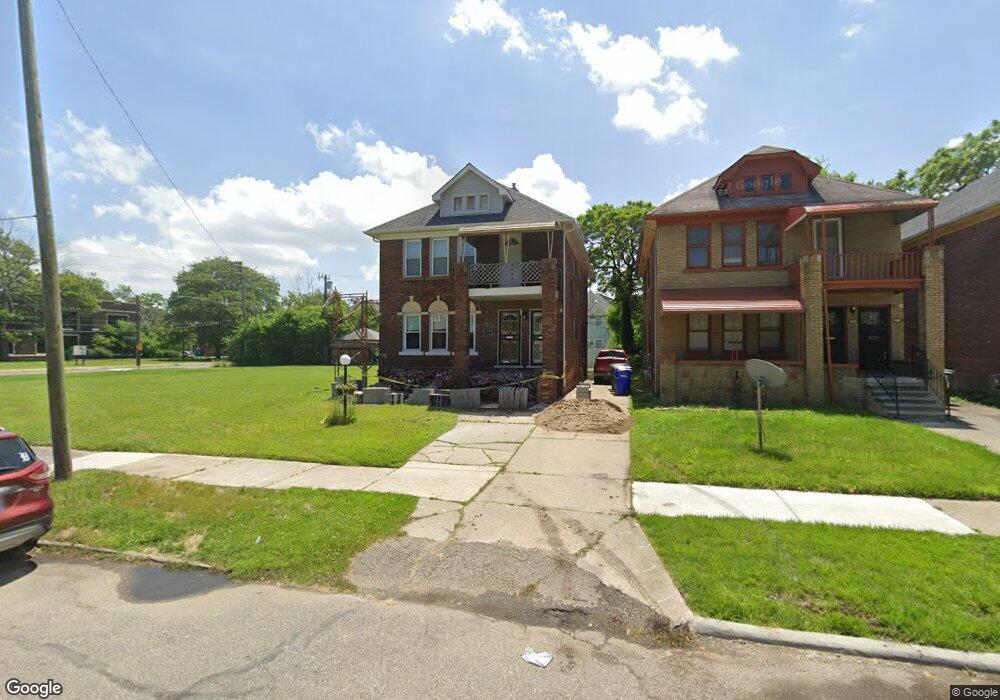
3221 Tyler St Detroit, MI 48238
Dexter-Linwood NeighborhoodEstimated Value: $73,581 - $139,000
6
Beds
2
Baths
2,112
Sq Ft
$50/Sq Ft
Est. Value
About This Home
This home is located at 3221 Tyler St, Detroit, MI 48238 and is currently estimated at $106,145, approximately $50 per square foot. 3221 Tyler St is a home located in Wayne County with nearby schools including Durfee Elementary-Middle School, Charles L. Spain Elementary-Middle School, and Edward 'Duke' Ellington Conservatory of Music and Art.
Ownership History
Date
Name
Owned For
Owner Type
Purchase Details
Closed on
Sep 23, 2019
Sold by
Greene Sylvia L
Bought by
Greene Sylvia L and Dunwoody Lawrence
Current Estimated Value
Purchase Details
Closed on
Sep 28, 2007
Sold by
Mortgage Electronic Registration Systems
Bought by
Dlj Mortgage Capital Inc
Purchase Details
Closed on
Aug 29, 2007
Sold by
Wallace Roger
Bought by
Mortgage Electronic Registration Systems
Purchase Details
Closed on
Oct 19, 2006
Sold by
Wadha Michael
Bought by
Wallace Roger
Purchase Details
Closed on
Oct 5, 2005
Sold by
Wadha Jeff
Bought by
Wadha Michael
Purchase Details
Closed on
Feb 11, 2004
Sold by
Craig Sharron
Bought by
Deutsche Bank National Trust Co and Long Beach Mortgage Loan Trust 2003-1
Purchase Details
Closed on
Oct 23, 2002
Sold by
Craig Emmett
Bought by
Craig Sharron
Create a Home Valuation Report for This Property
The Home Valuation Report is an in-depth analysis detailing your home's value as well as a comparison with similar homes in the area
Home Values in the Area
Average Home Value in this Area
Purchase History
| Date | Buyer | Sale Price | Title Company |
|---|---|---|---|
| Greene Sylvia L | -- | None Available | |
| Dlj Mortgage Capital Inc | -- | None Available | |
| Mortgage Electronic Registration Systems | $103,431 | None Available | |
| Wallace Roger | $109,000 | Tri County Title Agency Inc | |
| Wadha Michael | -- | Alpha Title Agency Inc | |
| Deutsche Bank National Trust Co | $68,846 | -- | |
| Craig Sharron | -- | -- |
Source: Public Records
Tax History Compared to Growth
Tax History
| Year | Tax Paid | Tax Assessment Tax Assessment Total Assessment is a certain percentage of the fair market value that is determined by local assessors to be the total taxable value of land and additions on the property. | Land | Improvement |
|---|---|---|---|---|
| 2025 | $838 | $26,000 | $0 | $0 |
| 2024 | $838 | $22,200 | $0 | $0 |
| 2023 | $936 | $17,600 | $0 | $0 |
| 2022 | $1,011 | $14,500 | $0 | $0 |
| 2021 | $1,056 | $12,100 | $0 | $0 |
| 2020 | $1,002 | $11,200 | $0 | $0 |
| 2019 | $964 | $10,000 | $0 | $0 |
| 2018 | $849 | $10,000 | $0 | $0 |
| 2017 | $193 | $10,200 | $0 | $0 |
| 2016 | $1,338 | $24,000 | $0 | $0 |
| 2015 | $1,320 | $13,200 | $0 | $0 |
| 2013 | $1,766 | $18,372 | $0 | $0 |
| 2010 | -- | $19,084 | $663 | $18,421 |
Source: Public Records
Map
Nearby Homes
- 3244 W Buena Vista St
- 3250 Tyler St
- 3276 Tyler St
- 3203 W Buena Vista St
- 3013 Waverly St
- 3336 Tyler St
- 3300 Waverly St
- 3351 Tyler St
- 3281 Glendale St
- 2979 Glendale St
- 3322 Leslie St
- 3225 Leslie St
- 2984 Leslie St
- 3741 Tyler St
- 2979 Clements St
- 3735 W Buena Vista St
- 3020 Clements St
- 3010 Fullerton St
- 2951 Leslie St
- 3775 Waverly St
- 3231 Tyler St
- 3237 Tyler St
- 3237 Tyler St Unit Lower
- 3239 Tyler St Unit Upper
- 3216 W Buena Vista St
- 3230 W Buena Vista St
- 3251 Tyler St
- 3210 W Buena Vista St
- 3236 W Buena Vista St
- 3200 W Buena Vista St
- 3222 Tyler St
- 3214 Tyler St
- 3230 Tyler St
- 3259 Tyler St
- 3236 Tyler St
- 3250 W Buena Vista St
- 3200 Tyler St
- 3265 Tyler St
- 3258 W Buena Vista St
- 3273 Tyler St