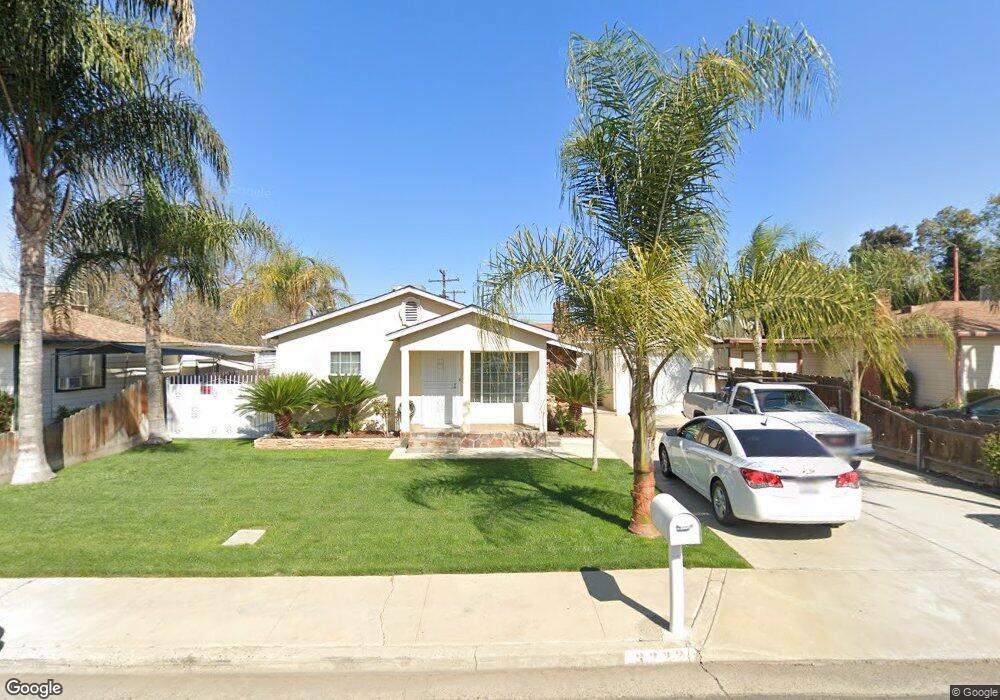
3222 E College Ave Visalia, CA 93292
Southeast Visalia NeighborhoodEstimated Value: $259,556 - $280,000
2
Beds
3
Baths
1,140
Sq Ft
$236/Sq Ft
Est. Value
About This Home
This home is located at 3222 E College Ave, Visalia, CA 93292 and is currently estimated at $268,639, approximately $235 per square foot. 3222 E College Ave is a home located in Tulare County with nearby schools including Mineral King Elementary School, Valley Oak Middle School, and Golden West High School.
Ownership History
Date
Name
Owned For
Owner Type
Purchase Details
Closed on
Feb 1, 2001
Sold by
Flores Jose
Bought by
Flores Lorena
Current Estimated Value
Purchase Details
Closed on
Mar 16, 1999
Sold by
California Housing Finance Agency
Bought by
Flores Jose and Flores Lorena
Home Financials for this Owner
Home Financials are based on the most recent Mortgage that was taken out on this home.
Original Mortgage
$50,400
Outstanding Balance
$12,500
Interest Rate
7.04%
Estimated Equity
$256,139
Purchase Details
Closed on
Aug 7, 1998
Sold by
Pardue William H
Bought by
California Housing Finance Agency
Purchase Details
Closed on
Apr 4, 1994
Sold by
Pardue Betty J
Bought by
Pardue William H
Home Financials for this Owner
Home Financials are based on the most recent Mortgage that was taken out on this home.
Original Mortgage
$73,200
Interest Rate
8.3%
Create a Home Valuation Report for This Property
The Home Valuation Report is an in-depth analysis detailing your home's value as well as a comparison with similar homes in the area
Home Values in the Area
Average Home Value in this Area
Purchase History
| Date | Buyer | Sale Price | Title Company |
|---|---|---|---|
| Flores Lorena | -- | -- | |
| Flores Jose | $56,000 | Cuesta Title Company | |
| California Housing Finance Agency | $76,677 | American Title Co | |
| Pardue William H | -- | Chicago Title Company | |
| Pardue William H | $75,500 | Chicago Title Company |
Source: Public Records
Mortgage History
| Date | Status | Borrower | Loan Amount |
|---|---|---|---|
| Open | Flores Jose | $50,400 | |
| Previous Owner | Pardue William H | $73,200 |
Source: Public Records
Tax History
| Year | Tax Paid | Tax Assessment Tax Assessment Total Assessment is a certain percentage of the fair market value that is determined by local assessors to be the total taxable value of land and additions on the property. | Land | Improvement |
|---|---|---|---|---|
| 2025 | $860 | $87,791 | $39,193 | $48,598 |
| 2024 | $860 | $86,071 | $38,425 | $47,646 |
| 2023 | $835 | $84,384 | $37,672 | $46,712 |
| 2022 | $796 | $82,731 | $36,934 | $45,797 |
| 2021 | $795 | $81,109 | $36,210 | $44,899 |
| 2020 | $780 | $80,278 | $35,839 | $44,439 |
| 2019 | $765 | $78,704 | $35,136 | $43,568 |
| 2018 | $736 | $77,161 | $34,447 | $42,714 |
| 2017 | $735 | $75,648 | $33,772 | $41,876 |
| 2016 | $712 | $74,165 | $33,110 | $41,055 |
| 2015 | $689 | $73,051 | $32,613 | $40,438 |
| 2014 | $689 | $71,620 | $31,974 | $39,646 |
Source: Public Records
Map
Nearby Homes
- 3000 E Westcott Ave
- 804 S Simon St
- 1010 S Lovers Ln
- 2916 E Tulare Ave
- 3646 E Meadow Ct
- 3220 E Tulare Ave
- 3232 E Tulare Ave
- 2928 E Tulare Ave
- 3709 E Cypress Ave
- 3632 E Willow Ct
- 3917 E Myrtle Ave
- 104 N Crumal St
- 3935 E Myrtle Ave
- 3148 E Duran Ave
- 352 S Wind Ct
- 2635 E Paradise Ave
- 703 S Grand St
- 3934 E Willow Ave
- 4122 E Kaweah Ave
- 4132 E Kaweah Ave
- 3232 E College Ave
- 3212 E College Ave
- 3250 E College Ave
- 3242 E College Ave
- 3200 E College Ave
- 748 S Velie St
- 744 S Velie St
- 3221 E College Ave
- 3231 E College Ave
- 3211 E College Ave
- 737 S Vista St
- 3241 E College Ave
- 3201 E College Ave
- 731 S Vista St
- 730 S Velie St
- 3134 E College Ave
- 3145 E College Ave
- 814 S Vista St
- 802 S Vista St
- 720 S Velie St
Your Personal Tour Guide
Ask me questions while you tour the home.