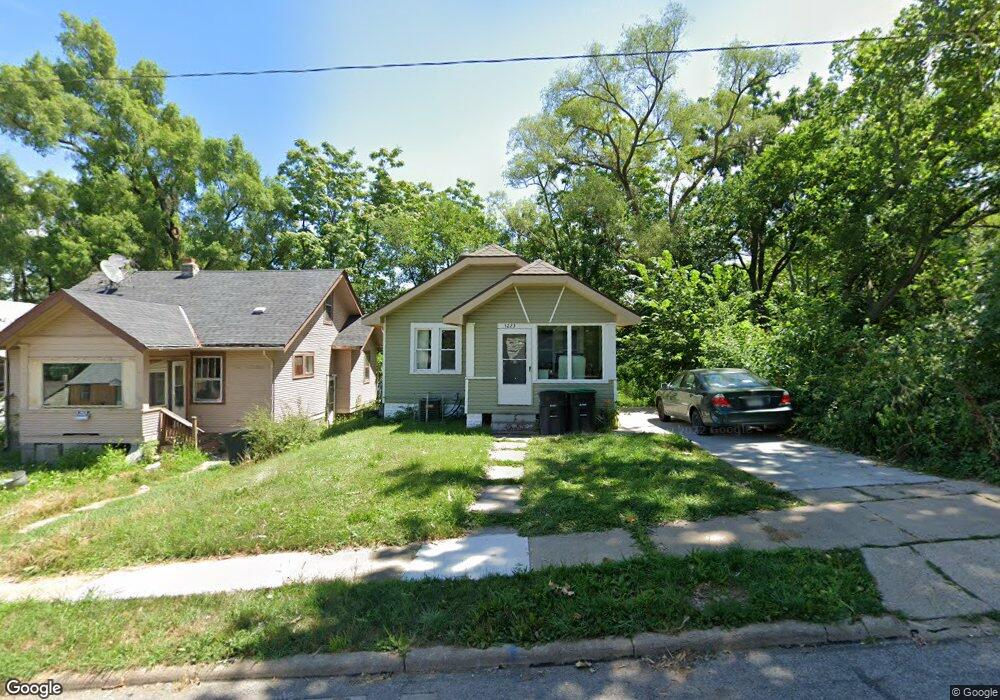
3223 N 40th Ave Omaha, NE 68111
Clifton Hills NeighborhoodEstimated Value: $112,000 - $156,000
2
Beds
1
Bath
616
Sq Ft
$204/Sq Ft
Est. Value
About This Home
This home is located at 3223 N 40th Ave, Omaha, NE 68111 and is currently estimated at $125,717, approximately $204 per square foot. 3223 N 40th Ave is a home located in Douglas County with nearby schools including King Elementary School, Monroe Middle School, and Benson Magnet High School.
Ownership History
Date
Name
Owned For
Owner Type
Purchase Details
Closed on
Mar 17, 2023
Sold by
C & N Investments Llc
Bought by
Sudar Nenad
Current Estimated Value
Home Financials for this Owner
Home Financials are based on the most recent Mortgage that was taken out on this home.
Original Mortgage
$80,000
Outstanding Balance
$77,484
Interest Rate
6.12%
Mortgage Type
New Conventional
Estimated Equity
$48,233
Purchase Details
Closed on
Oct 4, 2019
Sold by
Kcn Group Llc
Bought by
C & M Investments Llc
Home Financials for this Owner
Home Financials are based on the most recent Mortgage that was taken out on this home.
Original Mortgage
$100,000
Interest Rate
3.4%
Mortgage Type
Construction
Purchase Details
Closed on
Nov 16, 2018
Sold by
Christensen Lisa K and Christensen Jerry E
Bought by
Kcn Group Llc
Purchase Details
Closed on
Nov 8, 2012
Sold by
Vandelay Investments L L C
Bought by
Christensen Lisa K
Purchase Details
Closed on
Oct 5, 2011
Sold by
County Of Douglas
Bought by
Vandelay Investments Llc
Purchase Details
Closed on
May 26, 2006
Sold by
Miller Essie R
Bought by
Christensen Jerry E
Create a Home Valuation Report for This Property
The Home Valuation Report is an in-depth analysis detailing your home's value as well as a comparison with similar homes in the area
Home Values in the Area
Average Home Value in this Area
Purchase History
| Date | Buyer | Sale Price | Title Company |
|---|---|---|---|
| Sudar Nenad | $100,000 | Dri Title | |
| Sudar Nenad | $100,000 | Dri Title | |
| C & M Investments Llc | $12,000 | Dri Title & Escrow | |
| C & M Investments Llc | $12,000 | Dri Title & Escrow | |
| Kcn Group Llc | $25,000 | Dri Title & Escrow | |
| Kcn Group Llc | $25,000 | Dri Title & Escrow | |
| Christensen Lisa K | $4,000 | None Available | |
| Christensen Lisa K | $4,000 | None Available | |
| Vandelay Investments Llc | $517 | None Available | |
| Vandelay Investments Llc | $517 | None Available | |
| Christensen Jerry E | $14,000 | -- | |
| Christensen Jerry E | $14,000 | -- |
Source: Public Records
Mortgage History
| Date | Status | Borrower | Loan Amount |
|---|---|---|---|
| Open | Sudar Nenad | $80,000 | |
| Previous Owner | C & M Investments Llc | $100,000 |
Source: Public Records
Tax History Compared to Growth
Tax History
| Year | Tax Paid | Tax Assessment Tax Assessment Total Assessment is a certain percentage of the fair market value that is determined by local assessors to be the total taxable value of land and additions on the property. | Land | Improvement |
|---|---|---|---|---|
| 2025 | $1,237 | $89,400 | $7,500 | $81,900 |
| 2024 | $1,614 | $76,500 | $7,500 | $69,000 |
| 2023 | $1,614 | $76,500 | $7,500 | $69,000 |
| 2022 | $944 | $44,200 | $7,500 | $36,700 |
| 2021 | $933 | $44,100 | $7,500 | $36,600 |
| 2020 | $876 | $40,900 | $7,500 | $33,400 |
| 2019 | $530 | $24,700 | $700 | $24,000 |
| 2018 | $531 | $24,700 | $700 | $24,000 |
| 2017 | $275 | $19,000 | $700 | $18,300 |
| 2016 | $275 | $12,800 | $600 | $12,200 |
| 2015 | $434 | $20,500 | $2,400 | $18,100 |
| 2014 | $434 | $20,500 | $2,400 | $18,100 |
Source: Public Records
Map
Nearby Homes
- 4068 Bedford Ave
- 3914 Bedford Ave
- 3920 Spencer St
- 4121 Spencer St
- 4017 Wirt St
- 3317 N 39th St
- 3358 N 40th Ave
- 3510 N 40th Ave
- 4102 Pinkney St
- 4106 Pinkney St
- 3420 N 42nd St
- 3528 N 40th St
- 3701 Bedford Ave
- 3528 N 39th St
- 3532 N 39th St
- 4115 Maple St
- 3815 Maple St
- 4255 Wirt St
- 3537 N 39th St
- 4051 Pratt St
- 3223 N 40 Ave
- 3219 N 40th Ave
- 3225 N 40th Ave
- 3227 N 40th Ave
- 3215 N 40th Ave
- 3233 N 40th Ave
- 3224 N 40th St
- 3228 N 40th St
- 3220 N 40th St
- 3237 N 40th Ave
- 3216 N 40th St
- 3232 N 40th Ave
- 3236 N 40th St
- 4022 Spencer St
- 4018 Spencer St
- 4028 Spencer St
- 3224 N 40th Ave
- 3220 N 40th Ave
- 4016 Spencer St
- 3228 N 40th Ave