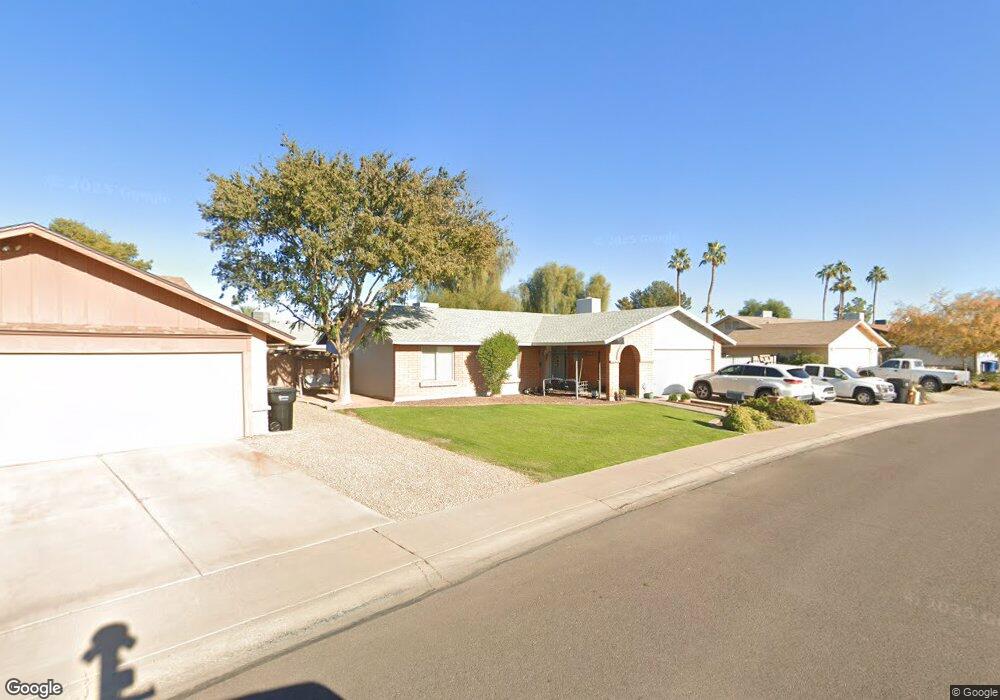
3223 N Desoto St Chandler, AZ 85224
Central Ridge NeighborhoodEstimated Value: $375,173 - $492,000
--
Bed
2
Baths
1,531
Sq Ft
$292/Sq Ft
Est. Value
About This Home
This home is located at 3223 N Desoto St, Chandler, AZ 85224 and is currently estimated at $446,793, approximately $291 per square foot. 3223 N Desoto St is a home located in Maricopa County with nearby schools including Pomeroy Elementary School, Franklin at Brimhall Elementary School, and Franklin Accelerated Academy Jordan Campus.
Ownership History
Date
Name
Owned For
Owner Type
Purchase Details
Closed on
Aug 29, 2002
Sold by
Fairchild Lisa and Wood Sue B
Bought by
Fairchild Lisa
Current Estimated Value
Home Financials for this Owner
Home Financials are based on the most recent Mortgage that was taken out on this home.
Original Mortgage
$130,804
Outstanding Balance
$55,159
Interest Rate
6.37%
Mortgage Type
FHA
Estimated Equity
$391,634
Purchase Details
Closed on
Nov 23, 1998
Sold by
Fairchild Lisa and Wood Sue B
Bought by
Fairchild Lisa and Wood Sue B
Home Financials for this Owner
Home Financials are based on the most recent Mortgage that was taken out on this home.
Original Mortgage
$104,550
Interest Rate
6.84%
Mortgage Type
FHA
Purchase Details
Closed on
Feb 21, 1997
Sold by
Salmon Michael D and Salmon Leveda P
Bought by
Fairchild Lisa and Wood Katie Sue Ballard
Home Financials for this Owner
Home Financials are based on the most recent Mortgage that was taken out on this home.
Original Mortgage
$106,084
Interest Rate
7.9%
Mortgage Type
FHA
Create a Home Valuation Report for This Property
The Home Valuation Report is an in-depth analysis detailing your home's value as well as a comparison with similar homes in the area
Home Values in the Area
Average Home Value in this Area
Purchase History
| Date | Buyer | Sale Price | Title Company |
|---|---|---|---|
| Fairchild Lisa | -- | Stewart Title & Trust | |
| Fairchild Lisa | -- | Nations Title Insurance | |
| Fairchild Lisa | $107,000 | Chicago Title Insurance Co |
Source: Public Records
Mortgage History
| Date | Status | Borrower | Loan Amount |
|---|---|---|---|
| Open | Fairchild Lisa | $130,804 | |
| Closed | Fairchild Lisa | $104,550 | |
| Closed | Fairchild Lisa | $106,084 |
Source: Public Records
Tax History Compared to Growth
Tax History
| Year | Tax Paid | Tax Assessment Tax Assessment Total Assessment is a certain percentage of the fair market value that is determined by local assessors to be the total taxable value of land and additions on the property. | Land | Improvement |
|---|---|---|---|---|
| 2025 | $1,661 | $16,462 | -- | -- |
| 2024 | $1,664 | $15,678 | -- | -- |
| 2023 | $1,664 | $34,130 | $6,820 | $27,310 |
| 2022 | $1,622 | $24,300 | $4,860 | $19,440 |
| 2021 | $1,612 | $22,570 | $4,510 | $18,060 |
| 2020 | $1,594 | $20,680 | $4,130 | $16,550 |
| 2019 | $1,482 | $18,980 | $3,790 | $15,190 |
| 2018 | $1,443 | $17,270 | $3,450 | $13,820 |
| 2017 | $1,391 | $15,970 | $3,190 | $12,780 |
| 2016 | $1,361 | $15,330 | $3,060 | $12,270 |
| 2015 | $1,276 | $13,710 | $2,740 | $10,970 |
Source: Public Records
Map
Nearby Homes
- 2811 W Rosewood Dr
- 2334 W Peralta Ave
- 2453 W Pecos Ave
- 2727 N Price Rd Unit 50
- 2727 N Price Rd Unit 57
- 2727 N Price Rd Unit 28
- 2674 N El Dorado Dr
- 2014 W Summit Place
- 2642 W Onza Ave
- 2337 W Cheyenne Dr
- 2559 W Olla Cir
- 2115 E Vaughn St
- 6411 S River Dr Unit 6
- 6411 S River Dr Unit 38
- 1978 E Stephens Dr
- 1800 W Rosewood Ct
- 2309 W Naranja Ave
- 2030 W Portobello Ave
- 2051 E Vaughn St
- 1975 E Sunburst Ln
- 3221 N Desoto St
- 3225 N Desoto St
- 3228 N Woodburne Dr
- 3230 N Woodburne Dr
- 3224 N Woodburne Dr
- 3219 N Desoto St
- 3214 N Desoto St
- 3227 N Desoto St
- 3232 N Woodburne Dr
- 3208 N Desoto St
- 3216 N Desoto St
- 3222 N Woodburne Dr
- 3217 N Desoto St
- 3234 N Woodburne Dr
- 3229 N Desoto St
- 3231 N Woodburne Dr
- 3229 N Woodburne Dr
- 3206 N Desoto St
- 3233 N Woodburne Dr
- 3212 N Desoto St