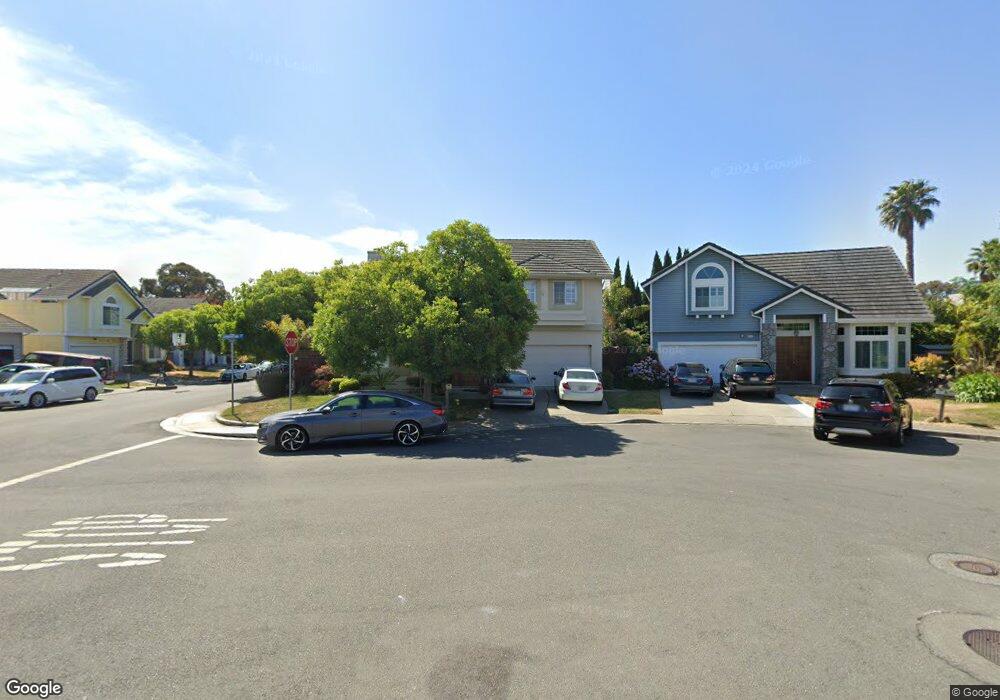
32231 Samantha Ct Union City, CA 94587
Alvarado NeighborhoodEstimated Value: $1,429,857 - $1,562,000
4
Beds
3
Baths
1,683
Sq Ft
$900/Sq Ft
Est. Value
About This Home
This home is located at 32231 Samantha Ct, Union City, CA 94587 and is currently estimated at $1,513,964, approximately $899 per square foot. 32231 Samantha Ct is a home located in Alameda County with nearby schools including Delaine Eastin Elementary School, Itliong-Vera Cruz, and James Logan High School.
Ownership History
Date
Name
Owned For
Owner Type
Purchase Details
Closed on
Dec 20, 2023
Sold by
Estabillo Macario and Estabillo Leila
Bought by
Marcario And Leila Estabillo 2023 Trust and Estabillo
Current Estimated Value
Purchase Details
Closed on
Oct 11, 2017
Sold by
Santos Apolinar
Bought by
Santos Perlita
Purchase Details
Closed on
Oct 24, 2001
Sold by
Santos Perlita and Estabillo Macario
Bought by
Estabillo Marcario and Estabillo Leila
Home Financials for this Owner
Home Financials are based on the most recent Mortgage that was taken out on this home.
Original Mortgage
$207,000
Interest Rate
6.73%
Purchase Details
Closed on
Jul 21, 1994
Sold by
Ho Carl Tsze Tung and Young Ho Michelle Mei Shuen
Bought by
Santos Perlita and Estabillo Macario
Create a Home Valuation Report for This Property
The Home Valuation Report is an in-depth analysis detailing your home's value as well as a comparison with similar homes in the area
Home Values in the Area
Average Home Value in this Area
Purchase History
| Date | Buyer | Sale Price | Title Company |
|---|---|---|---|
| Marcario And Leila Estabillo 2023 Trust | -- | None Listed On Document | |
| Estabillo Macario | -- | None Listed On Document | |
| Santos Perlita | -- | First American Title Company | |
| Estabillo Marcario | $69,000 | American Title Co | |
| Santos Perlita | -- | Fidelity National Title |
Source: Public Records
Mortgage History
| Date | Status | Borrower | Loan Amount |
|---|---|---|---|
| Previous Owner | Estabillo Marcario | $207,000 |
Source: Public Records
Tax History Compared to Growth
Tax History
| Year | Tax Paid | Tax Assessment Tax Assessment Total Assessment is a certain percentage of the fair market value that is determined by local assessors to be the total taxable value of land and additions on the property. | Land | Improvement |
|---|---|---|---|---|
| 2025 | $6,545 | $406,183 | $123,955 | $289,228 |
| 2024 | $6,545 | $398,082 | $121,524 | $283,558 |
| 2023 | $6,390 | $391,541 | $119,142 | $277,999 |
| 2022 | $6,262 | $389,355 | $116,806 | $272,549 |
| 2021 | $6,123 | $381,722 | $114,516 | $267,206 |
| 2020 | $6,012 | $377,808 | $113,342 | $264,466 |
| 2019 | $6,060 | $370,401 | $111,120 | $259,281 |
| 2018 | $5,918 | $363,140 | $108,942 | $254,198 |
| 2017 | $5,776 | $356,020 | $106,806 | $249,214 |
| 2016 | $5,570 | $349,041 | $104,712 | $244,329 |
| 2015 | $5,461 | $343,798 | $103,139 | $240,659 |
| 2014 | $5,257 | $337,066 | $101,120 | $235,946 |
Source: Public Records
Map
Nearby Homes
- 32447 Pacific Grove Way
- 32409 Elizabeth Way
- 4639 Michelle Ct
- 4506 Birchwood Ct
- 32451 Regents Blvd
- 4611 Carmen Way
- 4633 Granada Way
- 4475 Queen Anne Dr
- 4532 Delores Dr
- 4201 Saturn Way
- 4214 Saturn Way
- 4263 Queen Anne Dr
- 4167 Sunflower Ct
- 4243 Comet Cir
- 4100 Aquarius Cir
- 4231 Hanford St
- 32945 Regents Blvd
- 34102 Zaner Way
- 33064 Compton Ct
- 4272 Warbler Loop
- 4715 Andrea Way
- 32227 Samantha Ct
- 4719 Andrea Way
- 32240 Ashley Way
- 32223 Samantha Ct
- 32248 Ashley Way
- 32232 Ashley Way
- 4723 Andrea Way
- 32219 Samantha Ct
- 32256 Ashley Way
- 32224 Ashley Way
- 32211 Samantha Ct
- 32215 Samantha Ct
- 4755 Randi Ct
- 32241 Jean Dr
- 4727 Andrea Way
- 4714 Andrea Way
- 4751 Randi Ct
- 32249 Jean Dr
- 32233 Jean Dr