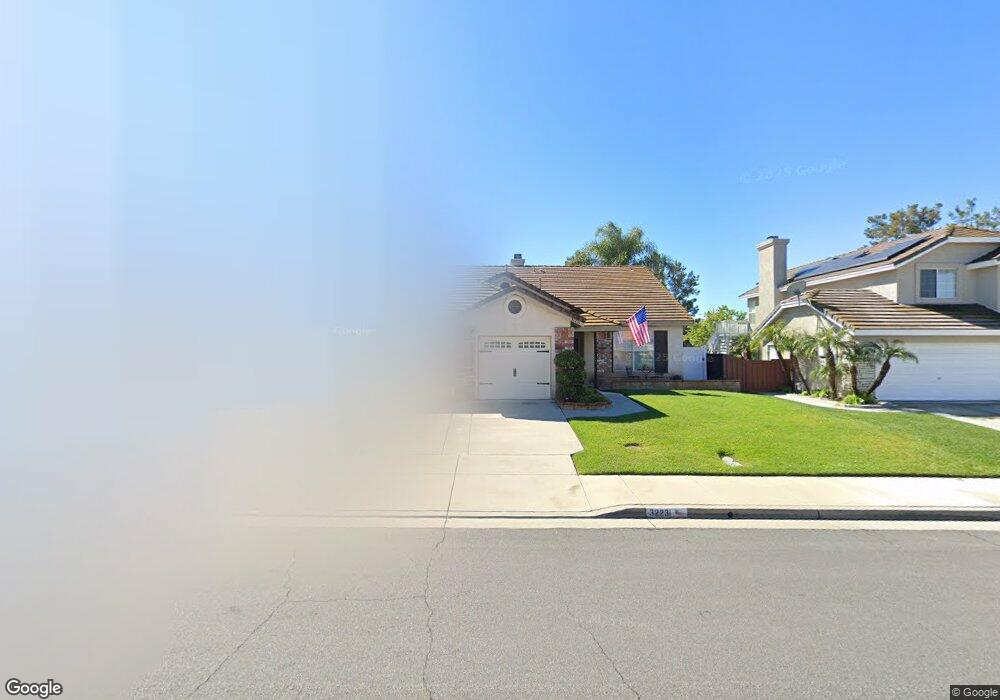
32231 Via Flore Temecula, CA 92592
Paloma del Sol NeighborhoodEstimated Value: $663,000 - $744,000
3
Beds
2
Baths
1,664
Sq Ft
$420/Sq Ft
Est. Value
About This Home
This home is located at 32231 Via Flore, Temecula, CA 92592 and is currently estimated at $698,280, approximately $419 per square foot. 32231 Via Flore is a home located in Riverside County with nearby schools including Paloma Elementary School, Temecula Middle School, and Temecula Valley High School.
Ownership History
Date
Name
Owned For
Owner Type
Purchase Details
Closed on
Dec 9, 2024
Sold by
Clough David Sean and Clough Shawna Lee
Bought by
Clough Family Trust and Clough
Current Estimated Value
Purchase Details
Closed on
Jul 16, 1998
Sold by
Croom Lonald D
Bought by
Clough David Sean and Clough Shawna Lee
Home Financials for this Owner
Home Financials are based on the most recent Mortgage that was taken out on this home.
Original Mortgage
$155,790
Interest Rate
6.93%
Mortgage Type
FHA
Purchase Details
Closed on
Mar 17, 1995
Sold by
Treese Rosemary T
Bought by
Croom Lonald D
Home Financials for this Owner
Home Financials are based on the most recent Mortgage that was taken out on this home.
Original Mortgage
$121,600
Interest Rate
8.81%
Purchase Details
Closed on
Nov 18, 1994
Sold by
Mesa Homes
Bought by
Treese John A and Treese Rosemary T
Create a Home Valuation Report for This Property
The Home Valuation Report is an in-depth analysis detailing your home's value as well as a comparison with similar homes in the area
Home Values in the Area
Average Home Value in this Area
Purchase History
| Date | Buyer | Sale Price | Title Company |
|---|---|---|---|
| Clough Family Trust | -- | None Listed On Document | |
| Clough David Sean | $160,000 | Lawyers Title Company | |
| Croom Lonald D | $128,000 | Stewart Title Co | |
| Treese John A | $127,000 | First American Title Ins Co |
Source: Public Records
Mortgage History
| Date | Status | Borrower | Loan Amount |
|---|---|---|---|
| Previous Owner | Clough David Sean | $155,790 | |
| Previous Owner | Croom Lonald D | $121,600 |
Source: Public Records
Tax History
| Year | Tax Paid | Tax Assessment Tax Assessment Total Assessment is a certain percentage of the fair market value that is determined by local assessors to be the total taxable value of land and additions on the property. | Land | Improvement |
|---|---|---|---|---|
| 2025 | $3,542 | $287,048 | $54,853 | $232,195 |
| 2023 | $3,542 | $275,904 | $52,724 | $223,180 |
| 2022 | $3,427 | $270,495 | $51,691 | $218,804 |
| 2021 | $3,351 | $265,192 | $50,678 | $214,514 |
| 2020 | $3,313 | $262,474 | $50,159 | $212,315 |
| 2019 | $3,263 | $257,328 | $49,176 | $208,152 |
| 2018 | $3,196 | $252,283 | $48,213 | $204,070 |
| 2017 | $3,137 | $247,337 | $47,268 | $200,069 |
| 2016 | $3,078 | $242,489 | $46,342 | $196,147 |
| 2015 | $3,022 | $238,848 | $45,647 | $193,201 |
| 2014 | $2,929 | $234,170 | $44,753 | $189,417 |
Source: Public Records
Map
Nearby Homes
- 32127 Camino Rabago
- 43445 Corte Almeria
- 43993 Barletta St
- 0 De Portola Unit SW25275250
- 0 De Portola Unit SW25275215
- 43898 Carentan Dr
- 43922 Carentan Dr
- 44011 Rivo Ct
- 43740 Calabro St
- 43425 Corte Logrono
- 44049 Terraza Ct
- 31972 Calle Balareza
- 31950 Via Tafalla
- 44006 Terraza Ct
- 32274 Corte Illora
- 43922 Sassari St
- 43353 Dodaro Dr
- 31850 Via Barraza
- 31849 Corte Priego
- 32836 Caserta Dr
- 32245 Via Flore
- 32217 Via Flore
- 32203 Via Flore
- 32259 Via Flore
- 43519 Via Candeleda
- 32218 Via Flore
- 32189 Via Flore
- 43538 Via Candeleda
- 32204 Via Flore
- 32240 Camino Caliari
- 43505 Via Candeleda
- 32250 Camino Caliari
- 43524 Via Candeleda
- 32190 Via Flore
- 32210 Camino Caliari
- 43510 Via Candeleda
- 43491 Via Candeleda
- 32176 Via Flore
- 32200 Camino Caliari
- 43496 Via Candeleda
Your Personal Tour Guide
Ask me questions while you tour the home.