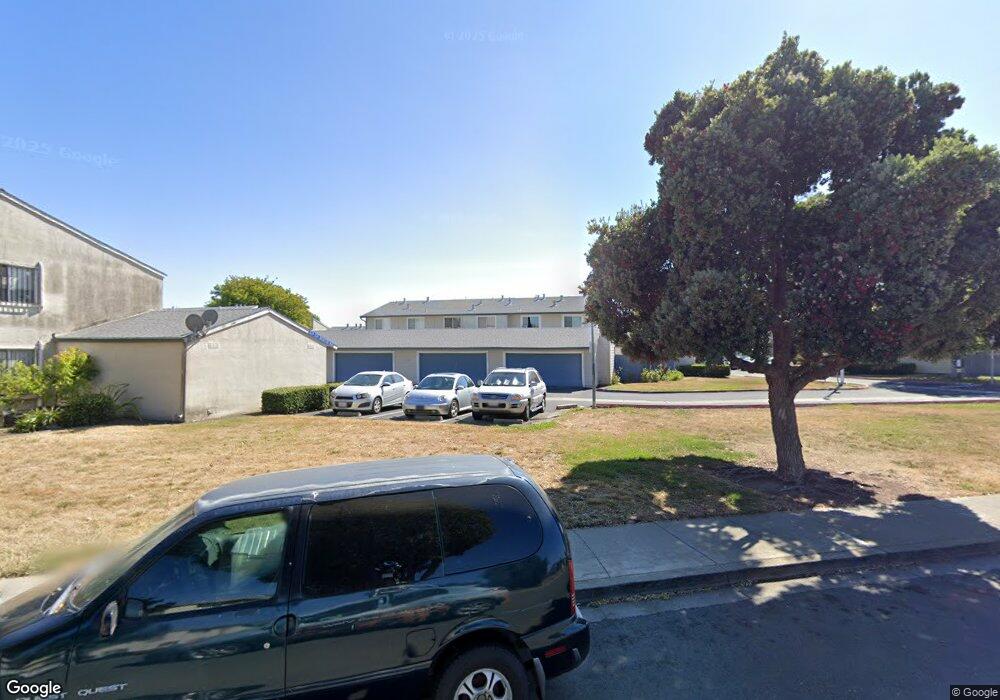
32236 Mercury Way Union City, CA 94587
Alvarado NeighborhoodEstimated Value: $742,000 - $801,000
3
Beds
3
Baths
1,137
Sq Ft
$673/Sq Ft
Est. Value
About This Home
This home is located at 32236 Mercury Way, Union City, CA 94587 and is currently estimated at $765,535, approximately $673 per square foot. 32236 Mercury Way is a home located in Alameda County with nearby schools including Pioneer Elementary School, Itliong-Vera Cruz, and James Logan High School.
Ownership History
Date
Name
Owned For
Owner Type
Purchase Details
Closed on
Mar 1, 2022
Sold by
Lopez Reina R and Lopez Carlos Teresita
Bought by
Lopez Reina R
Current Estimated Value
Home Financials for this Owner
Home Financials are based on the most recent Mortgage that was taken out on this home.
Original Mortgage
$583,342
Outstanding Balance
$545,029
Interest Rate
3.92%
Mortgage Type
FHA
Estimated Equity
$220,506
Purchase Details
Closed on
Aug 25, 2015
Sold by
Valsamma Joseph Vattamattathil M and Valsamma Joseph
Bought by
Lopez Reina R
Home Financials for this Owner
Home Financials are based on the most recent Mortgage that was taken out on this home.
Original Mortgage
$460,505
Interest Rate
4.25%
Mortgage Type
FHA
Purchase Details
Closed on
May 21, 2015
Sold by
Joseph Tony
Bought by
Valsamma Joseph Vattamattathil M and Valsamma Joseph
Purchase Details
Closed on
Aug 23, 2004
Sold by
Joseph Josilin
Bought by
Valsamma Joseph Vattamattathil M and Valsamma Joseph
Home Financials for this Owner
Home Financials are based on the most recent Mortgage that was taken out on this home.
Original Mortgage
$236,950
Interest Rate
5.25%
Mortgage Type
Purchase Money Mortgage
Purchase Details
Closed on
Jun 12, 2002
Sold by
Singh Jaspal and Kaur Jasvir
Bought by
Joseph Josilin
Home Financials for this Owner
Home Financials are based on the most recent Mortgage that was taken out on this home.
Original Mortgage
$238,800
Interest Rate
6.74%
Purchase Details
Closed on
Jun 11, 1999
Sold by
Saini Mareena S
Bought by
Saini Malook S
Home Financials for this Owner
Home Financials are based on the most recent Mortgage that was taken out on this home.
Original Mortgage
$143,200
Interest Rate
7.01%
Purchase Details
Closed on
May 21, 1998
Sold by
Timbang Francisco D and Timbang Ofelia T
Bought by
G S I S Inc Corp
Home Financials for this Owner
Home Financials are based on the most recent Mortgage that was taken out on this home.
Original Mortgage
$133,000
Interest Rate
7.06%
Purchase Details
Closed on
Apr 16, 1998
Sold by
Timbang Timbang Virginia Virginia and Timbang Virginia D
Bought by
Timbang Francisco D and Timbang Ofelia T
Home Financials for this Owner
Home Financials are based on the most recent Mortgage that was taken out on this home.
Original Mortgage
$133,000
Interest Rate
7.06%
Create a Home Valuation Report for This Property
The Home Valuation Report is an in-depth analysis detailing your home's value as well as a comparison with similar homes in the area
Home Values in the Area
Average Home Value in this Area
Purchase History
| Date | Buyer | Sale Price | Title Company |
|---|---|---|---|
| Lopez Reina R | -- | Orange Coast Title | |
| Lopez Reina R | $470,000 | Old Republic Title Company | |
| Valsamma Joseph Vattamattathil M | -- | None Available | |
| Valsamma Joseph Vattamattathil M | $325,000 | Ticor Title Company Of Ca | |
| Joseph Josilin | $298,500 | North American Title Co | |
| Saini Malook S | -- | American Title Co | |
| Singh Jaspal | $179,000 | American Title Co | |
| G S I S Inc Corp | $145,454 | -- | |
| Timbang Francisco D | $66,500 | American Title Co |
Source: Public Records
Mortgage History
| Date | Status | Borrower | Loan Amount |
|---|---|---|---|
| Open | Lopez Reina R | $583,342 | |
| Previous Owner | Lopez Reina R | $460,505 | |
| Previous Owner | Valsamma Joseph Vattamattathil M | $236,950 | |
| Previous Owner | Joseph Josilin | $238,800 | |
| Previous Owner | Singh Jaspal | $143,200 | |
| Previous Owner | Timbang Francisco D | $133,000 |
Source: Public Records
Tax History Compared to Growth
Tax History
| Year | Tax Paid | Tax Assessment Tax Assessment Total Assessment is a certain percentage of the fair market value that is determined by local assessors to be the total taxable value of land and additions on the property. | Land | Improvement |
|---|---|---|---|---|
| 2025 | $8,084 | $556,371 | $166,911 | $389,460 |
| 2024 | $8,084 | $545,462 | $163,638 | $381,824 |
| 2023 | $7,820 | $534,770 | $160,431 | $374,339 |
| 2022 | $7,683 | $524,284 | $157,285 | $366,999 |
| 2021 | $7,516 | $514,005 | $154,201 | $359,804 |
| 2020 | $7,360 | $508,737 | $152,621 | $356,116 |
| 2019 | $7,433 | $498,763 | $149,629 | $349,134 |
| 2018 | $7,262 | $488,987 | $146,696 | $342,291 |
| 2017 | $7,090 | $479,400 | $143,820 | $335,580 |
| 2016 | $6,833 | $470,000 | $141,000 | $329,000 |
| 2015 | $5,698 | $387,637 | $116,332 | $271,305 |
| 2014 | $5,069 | $345,000 | $103,500 | $241,500 |
Source: Public Records
Map
Nearby Homes
- 4214 Saturn Way
- 4501 Alice Way
- 4100 Aquarius Cir
- 32451 Regents Blvd
- 4243 Comet Cir
- 4263 Queen Anne Dr
- 4167 Sunflower Ct
- 4231 Hanford St
- 4532 Delores Dr
- 32409 Elizabeth Way
- 4476 Madrid Ct
- 32542 Lake Tana St
- 4633 Granada Way
- 4611 Carmen Way
- 4639 Michelle Ct
- 32425 Pacific Grove Way
- 32461 Darlene Way
- 32447 Pacific Grove Way
- 31226 Lily St
- 34102 Zaner Way
- 32238 Mercury Way
- 32234 Mercury Way
- 32240 Mercury Way
- 32242 Mercury Way
- 4396 Planet Cir
- 4394 Planet Cir
- 32239 Mercury Way
- 32244 Mercury Way
- 4390 Planet Cir
- 32241 Mercury Way
- 32230 Mercury Way
- 32246 Mercury Way
- 32243 Mercury Way
- 4300 Planet Cir
- 32228 Mercury Way
- 32245 Mercury Way
- 32248 Mercury Way
- 4388 Planet Cir
- 4302 Planet Cir
- 32226 Mercury Way