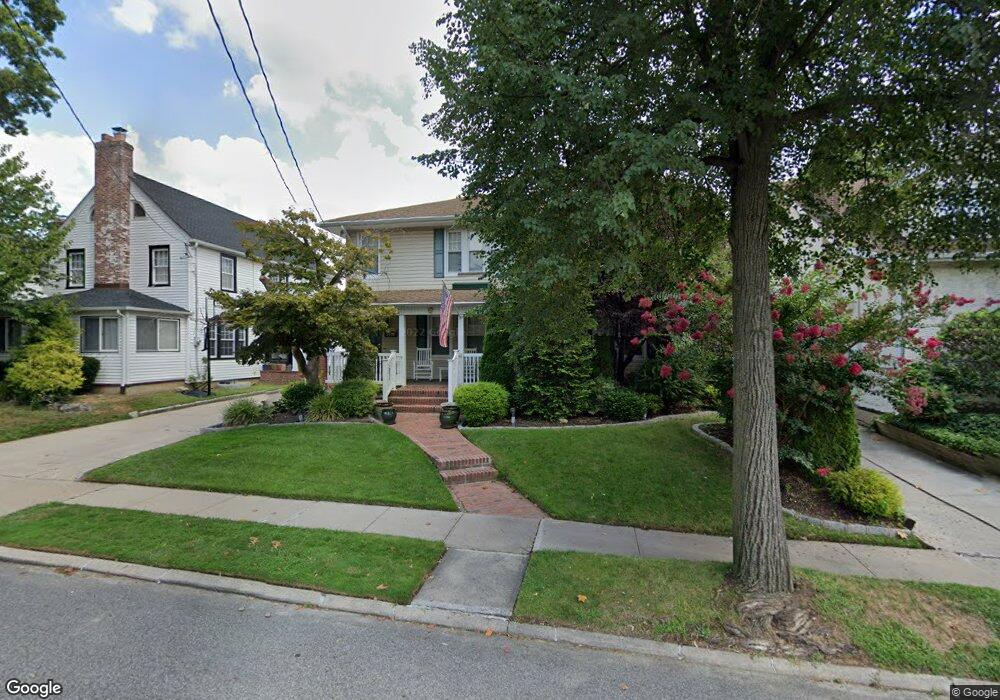
3225 159th St Flushing, NY 11358
Flushing NeighborhoodEstimated Value: $1,362,619 - $1,575,000
--
Bed
--
Bath
2,301
Sq Ft
$652/Sq Ft
Est. Value
About This Home
This home is located at 3225 159th St, Flushing, NY 11358 and is currently estimated at $1,500,405, approximately $652 per square foot. 3225 159th St is a home located in Queens County with nearby schools including P.S. 32 - State Street, I.S. 25 Adrien Block, and Francis Lewis High School.
Ownership History
Date
Name
Owned For
Owner Type
Purchase Details
Closed on
Sep 9, 2005
Sold by
Schettino Grace E and Schettino Thomas W
Bought by
Murillo Rudy
Current Estimated Value
Home Financials for this Owner
Home Financials are based on the most recent Mortgage that was taken out on this home.
Original Mortgage
$593,250
Interest Rate
5.92%
Mortgage Type
Purchase Money Mortgage
Create a Home Valuation Report for This Property
The Home Valuation Report is an in-depth analysis detailing your home's value as well as a comparison with similar homes in the area
Home Values in the Area
Average Home Value in this Area
Purchase History
| Date | Buyer | Sale Price | Title Company |
|---|---|---|---|
| Murillo Rudy | $791,000 | -- | |
| Murillo Rudy | $791,000 | -- |
Source: Public Records
Mortgage History
| Date | Status | Borrower | Loan Amount |
|---|---|---|---|
| Open | Murillo Rudy | $197,750 | |
| Closed | Murillo Rudy | $197,750 | |
| Previous Owner | Murillo Rudy | $593,250 |
Source: Public Records
Tax History Compared to Growth
Tax History
| Year | Tax Paid | Tax Assessment Tax Assessment Total Assessment is a certain percentage of the fair market value that is determined by local assessors to be the total taxable value of land and additions on the property. | Land | Improvement |
|---|---|---|---|---|
| 2025 | $12,997 | $67,999 | $19,902 | $48,097 |
| 2024 | $12,997 | $64,709 | $19,484 | $45,225 |
| 2023 | $12,374 | $61,606 | $17,954 | $43,652 |
| 2022 | $12,020 | $80,340 | $24,480 | $55,860 |
| 2021 | $12,641 | $66,600 | $24,480 | $42,120 |
| 2020 | $11,995 | $72,420 | $24,480 | $47,940 |
| 2019 | $11,280 | $64,380 | $24,480 | $39,900 |
| 2018 | $10,465 | $51,338 | $16,690 | $34,648 |
| 2017 | $10,228 | $50,176 | $17,587 | $32,589 |
| 2016 | $10,006 | $50,176 | $17,587 | $32,589 |
| 2015 | $5,709 | $47,222 | $23,026 | $24,196 |
| 2014 | $5,709 | $44,937 | $21,051 | $23,886 |
Source: Public Records
Map
Nearby Homes