3225 Fullerton St Unit Bldg-Unit Detroit, MI 48238
Dexter-Linwood NeighborhoodEstimated Value: $107,000 - $216,844
--
Bed
3
Baths
2,900
Sq Ft
$52/Sq Ft
Est. Value
About This Home
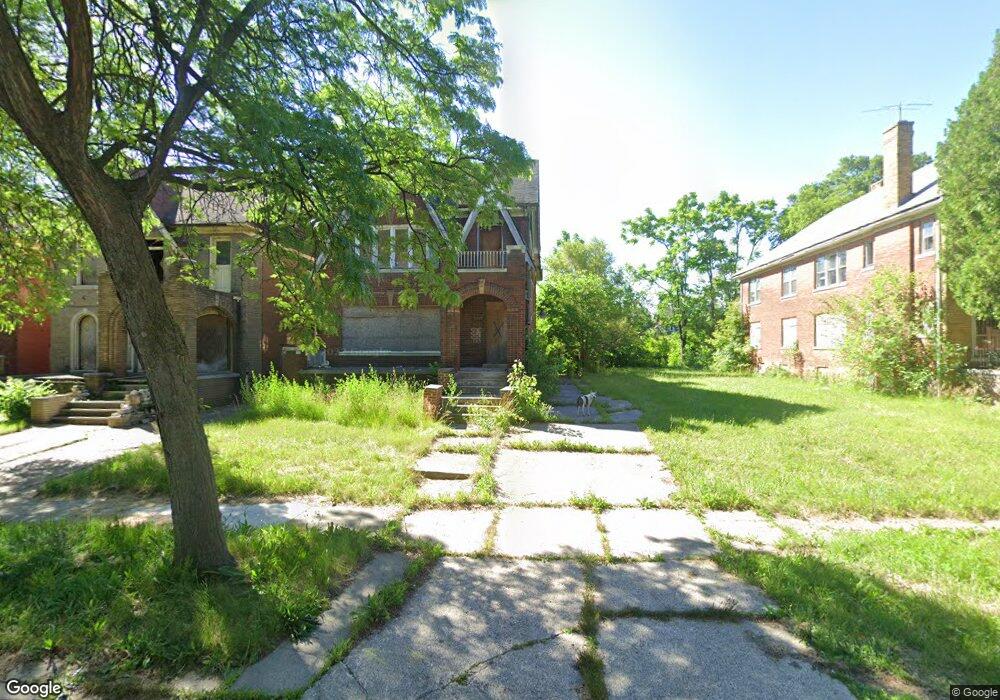
This home is located at 3225 Fullerton St Unit Bldg-Unit, Detroit, MI 48238 and is currently estimated at $149,711, approximately $51 per square foot. 3225 Fullerton St Unit Bldg-Unit is a home located in Wayne County with nearby schools including Durfee Elementary-Middle School, Charles L. Spain Elementary-Middle School, and Edward 'Duke' Ellington Conservatory of Music and Art.
Ownership History
Date
Name
Owned For
Owner Type
Purchase Details
Closed on
Dec 27, 2017
Sold by
Yonatan & Gura Llc
Bought by
The Islanders Llc
Current Estimated Value
Purchase Details
Closed on
Nov 10, 2015
Sold by
Treasurer Of The Charter County Of Wayne
Bought by
Yonatan & Gura Llc
Purchase Details
Closed on
Feb 13, 2012
Sold by
Allen & Allen Enterprises Llc
Bought by
Correia Donald
Purchase Details
Closed on
Jul 29, 2010
Sold by
Flowers Quency and Flowers Arthur G
Bought by
Us Bank National Association
Purchase Details
Closed on
May 21, 2010
Sold by
Flowers Arthur and Flowers Quency
Bought by
Allen & Allen Enterprise Llc
Purchase Details
Closed on
Jul 28, 2006
Sold by
Robinson Florence E and Robinson Thomas Florence Elizabeth
Bought by
Littlejohn Darryl
Create a Home Valuation Report for This Property
The Home Valuation Report is an in-depth analysis detailing your home's value as well as a comparison with similar homes in the area
Home Values in the Area
Average Home Value in this Area
Purchase History
| Date | Buyer | Sale Price | Title Company |
|---|---|---|---|
| The Islanders Llc | $5,000 | None Available | |
| Yonatan & Gura Llc | $900 | None Available | |
| Correia Donald | $9,500 | Title Connect Llc | |
| Us Bank National Association | $3,150 | None Available | |
| Allen & Allen Enterprise Llc | $9,900 | Philip R Seaver Title Co Inc | |
| Littlejohn Darryl | $160,000 | Multiple |
Source: Public Records
Tax History Compared to Growth
Tax History
| Year | Tax Paid | Tax Assessment Tax Assessment Total Assessment is a certain percentage of the fair market value that is determined by local assessors to be the total taxable value of land and additions on the property. | Land | Improvement |
|---|---|---|---|---|
| 2025 | $1,421 | $36,100 | $0 | $0 |
| 2024 | $1,421 | $30,500 | $0 | $0 |
| 2023 | $1,625 | $24,400 | $0 | $0 |
| 2022 | $790 | $21,000 | $0 | $0 |
| 2021 | $1,684 | $17,000 | $0 | $0 |
| 2020 | $1,684 | $15,800 | $0 | $0 |
| 2019 | $1,659 | $14,900 | $0 | $0 |
| 2018 | $1,141 | $15,000 | $0 | $0 |
| 2017 | $193 | $15,400 | $0 | $0 |
| 2016 | $1,239 | $36,100 | $0 | $0 |
| 2015 | $1,060 | $10,600 | $0 | $0 |
| 2013 | $1,473 | $14,729 | $0 | $0 |
| 2010 | -- | $23,376 | $989 | $22,387 |
Source: Public Records
Map
Nearby Homes
- 3251 Fullerton St
- 3225 Leslie St
- 3330 Sturtevant St
- 3200 Cortland St
- 3010 Fullerton St
- 3322 Leslie St
- 3281 Glendale St
- 3273 Cortland St
- 3000 Cortland St
- 3240 Richton St
- 3222 Richton St
- 2984 Leslie St
- 2951 Leslie St
- 2964 Leslie St
- 2979 Glendale St
- 2922 Fullerton St
- 2919 Fullerton St
- 3203 W Buena Vista St
- 3244 W Buena Vista St
- 12170 Dexter Ave
- 3225 Fullerton St
- 3217 Fullerton St
- 3231 Fullerton St
- 3209 Fullerton St
- 3239 Fullerton St
- 3245 Fullerton St
- 3203 Fullerton St
- 3224 Sturtevant St
- 3220 Sturtevant St
- 3232 Sturtevant St
- 3288 Fullerton St
- 3212 Sturtevant St
- 3240 Sturtevant St
- 3202 Sturtevant St
- 3259 Fullerton St
- 3246 Sturtevant St
- 3224 Fullerton St
- 3230 Fullerton St
- 3208 Fullerton St
- 3042 Sturtevant St