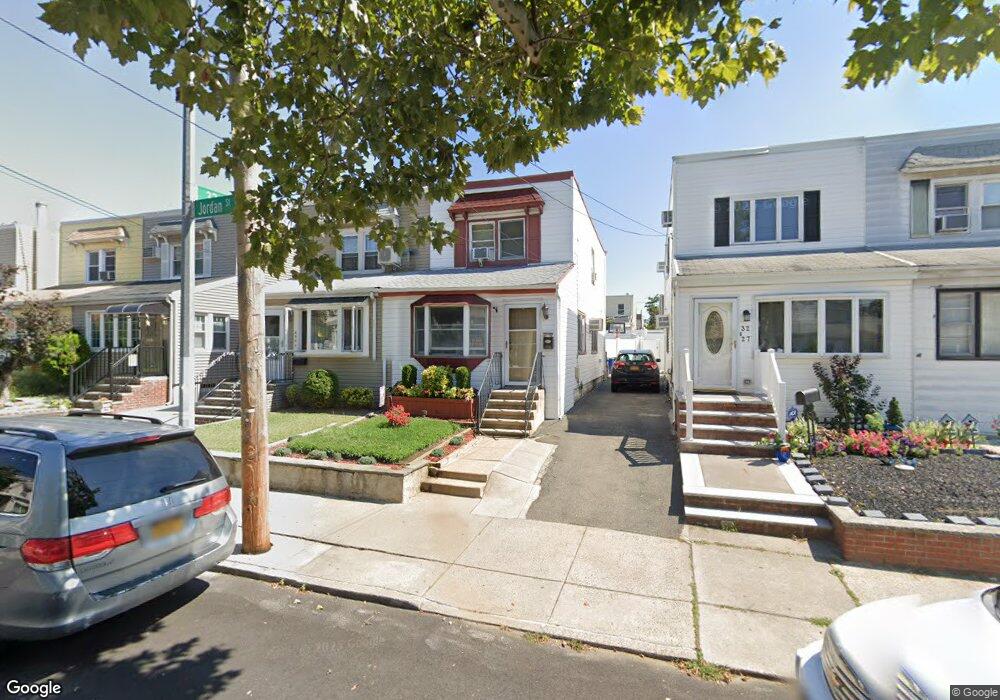
3225 Jordan St Flushing, NY 11358
Auburndale NeighborhoodEstimated Value: $736,000 - $836,850
Studio
--
Bath
1,080
Sq Ft
$718/Sq Ft
Est. Value
About This Home
This home is located at 3225 Jordan St, Flushing, NY 11358 and is currently estimated at $775,713, approximately $718 per square foot. 3225 Jordan St is a home located in Queens County with nearby schools including P.S. 159 Queens, I.S. 25 Adrien Block, and Bayside High School.
Ownership History
Date
Name
Owned For
Owner Type
Purchase Details
Closed on
Jun 12, 2008
Sold by
Gitelman Ronan and Soto-Gitelman Yvette
Bought by
Ng-Walker Tuenha and Walker Scott
Current Estimated Value
Home Financials for this Owner
Home Financials are based on the most recent Mortgage that was taken out on this home.
Original Mortgage
$386,400
Outstanding Balance
$246,042
Interest Rate
6.07%
Mortgage Type
Purchase Money Mortgage
Estimated Equity
$529,671
Purchase Details
Closed on
Aug 29, 2007
Sold by
Gitelman Ronen and Soto-Gitelman Yvette
Bought by
Gitelman Ronen and Soto-Gitelman Yvette
Purchase Details
Closed on
Sep 17, 2001
Sold by
Kling Leo L and Kling Susan A
Bought by
Soto Yvette
Home Financials for this Owner
Home Financials are based on the most recent Mortgage that was taken out on this home.
Original Mortgage
$220,000
Interest Rate
6.86%
Create a Home Valuation Report for This Property
The Home Valuation Report is an in-depth analysis detailing your home's value as well as a comparison with similar homes in the area
Home Values in the Area
Average Home Value in this Area
Purchase History
| Date | Buyer | Sale Price | Title Company |
|---|---|---|---|
| Ng-Walker Tuenha | $483,000 | -- | |
| Ng-Walker Tuenha | $483,000 | -- | |
| Gitelman Ronen | -- | -- | |
| Gitelman Ronen | -- | -- | |
| Soto Yvette | -- | -- | |
| Soto Yvette | -- | -- |
Source: Public Records
Mortgage History
| Date | Status | Borrower | Loan Amount |
|---|---|---|---|
| Open | Ng-Walker Tuenha | $386,400 | |
| Closed | Ng-Walker Tuenha | $386,400 | |
| Previous Owner | Soto Yvette | $220,000 | |
| Closed | Gitelman Ronen | $0 |
Source: Public Records
Tax History
| Year | Tax Paid | Tax Assessment Tax Assessment Total Assessment is a certain percentage of the fair market value that is determined by local assessors to be the total taxable value of land and additions on the property. | Land | Improvement |
|---|---|---|---|---|
| 2025 | $4,806 | $26,836 | $7,339 | $19,497 |
| 2024 | $4,818 | $25,326 | $7,395 | $17,931 |
| 2023 | $4,518 | $23,893 | $7,137 | $16,756 |
| 2022 | $4,219 | $42,120 | $13,980 | $28,140 |
| 2021 | $4,417 | $44,760 | $13,980 | $30,780 |
| 2020 | $4,438 | $43,920 | $13,980 | $29,940 |
| 2019 | $4,122 | $44,340 | $13,980 | $30,360 |
| 2018 | $3,761 | $19,911 | $7,237 | $12,674 |
| 2017 | $3,535 | $18,810 | $7,416 | $11,394 |
| 2016 | $3,421 | $18,810 | $7,416 | $11,394 |
| 2015 | $1,920 | $18,636 | $8,322 | $10,314 |
| 2014 | $1,920 | $17,588 | $8,105 | $9,483 |
Source: Public Records
Map
Nearby Homes
- 32-19 Jordan St
- 3227 202nd St
- 3228 Utopia Pkwy
- 20206 33rd Ave
- 34-12 192nd St
- 2952 172nd St
- 3226 204th St
- 3314 204th St
- 28-07 172nd St
- 201-05 28th Ave
- 29-31 170th St
- 204-11 34th Ave
- 205-12 34th Ave
- 29 Avenue
- 36-20 194th St Unit 3r
- 34-32 205th St
- 35-05 204th St Unit 245
- 29-37 168th St
- 3617 194th St
- 204-12 35th Ave Unit 254
Your Personal Tour Guide
Ask me questions while you tour the home.