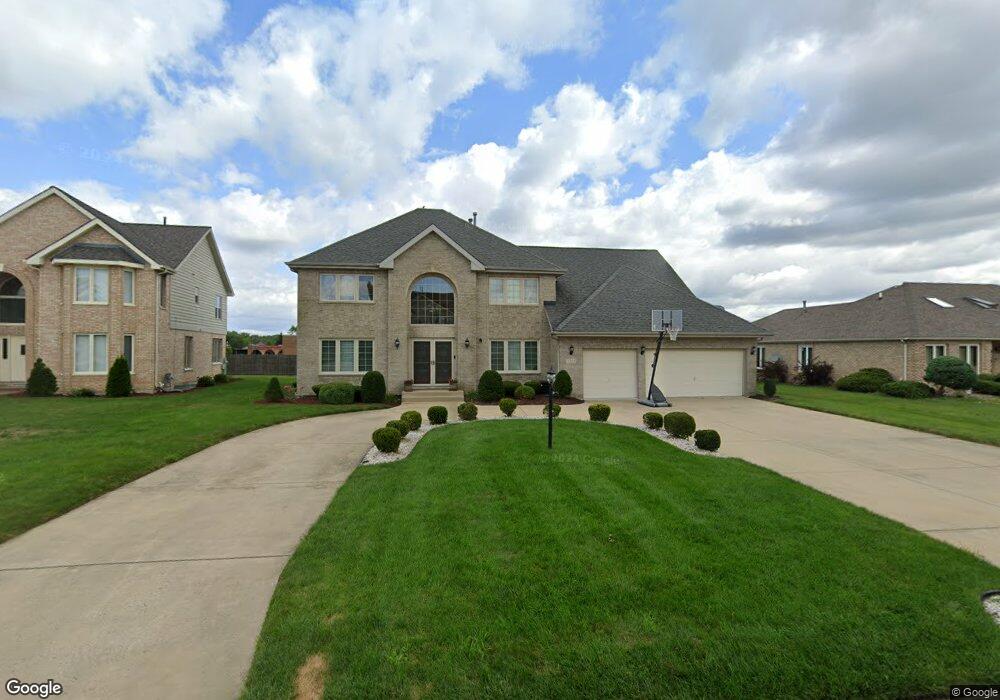
3225 Oregon Trail Olympia Fields, IL 60461
Estimated Value: $405,000 - $441,000
4
Beds
3
Baths
3,030
Sq Ft
$139/Sq Ft
Est. Value
About This Home
This home is located at 3225 Oregon Trail, Olympia Fields, IL 60461 and is currently estimated at $421,626, approximately $139 per square foot. 3225 Oregon Trail is a home located in Cook County with nearby schools including Illinois School, Arcadia Elementary School, and Indiana Elementary School.
Ownership History
Date
Name
Owned For
Owner Type
Purchase Details
Closed on
Jun 19, 2018
Sold by
Huff George and Huff Jacqueline
Bought by
Huff Jacqueline and Huff George S
Current Estimated Value
Purchase Details
Closed on
Sep 4, 1996
Sold by
C M S Developers Inc
Bought by
Huff George and Huff Jacqueline
Home Financials for this Owner
Home Financials are based on the most recent Mortgage that was taken out on this home.
Original Mortgage
$230,000
Outstanding Balance
$18,743
Interest Rate
7.62%
Estimated Equity
$402,883
Purchase Details
Closed on
Jun 20, 1996
Sold by
First United Bank
Bought by
C M S Developers Inc
Home Financials for this Owner
Home Financials are based on the most recent Mortgage that was taken out on this home.
Original Mortgage
$237,900
Interest Rate
8.13%
Create a Home Valuation Report for This Property
The Home Valuation Report is an in-depth analysis detailing your home's value as well as a comparison with similar homes in the area
Home Values in the Area
Average Home Value in this Area
Purchase History
| Date | Buyer | Sale Price | Title Company |
|---|---|---|---|
| Huff Jacqueline | -- | None Available | |
| Huff George | $294,500 | -- | |
| C M S Developers Inc | -- | -- |
Source: Public Records
Mortgage History
| Date | Status | Borrower | Loan Amount |
|---|---|---|---|
| Open | Huff George | $230,000 | |
| Previous Owner | C M S Developers Inc | $237,900 |
Source: Public Records
Tax History Compared to Growth
Tax History
| Year | Tax Paid | Tax Assessment Tax Assessment Total Assessment is a certain percentage of the fair market value that is determined by local assessors to be the total taxable value of land and additions on the property. | Land | Improvement |
|---|---|---|---|---|
| 2024 | $12,198 | $34,001 | $5,738 | $28,263 |
| 2023 | $9,866 | $34,001 | $5,738 | $28,263 |
| 2022 | $9,866 | $23,530 | $6,375 | $17,155 |
| 2021 | $9,882 | $23,529 | $6,375 | $17,154 |
| 2020 | $9,244 | $23,529 | $6,375 | $17,154 |
| 2019 | $9,616 | $24,523 | $5,737 | $18,786 |
| 2018 | $9,542 | $24,523 | $5,737 | $18,786 |
| 2017 | $9,279 | $24,523 | $5,737 | $18,786 |
| 2016 | $10,158 | $24,510 | $5,100 | $19,410 |
| 2015 | $10,018 | $24,510 | $5,100 | $19,410 |
| 2014 | $9,837 | $24,510 | $5,100 | $19,410 |
| 2013 | $11,343 | $29,924 | $5,100 | $24,824 |
Source: Public Records
Map
Nearby Homes
- 3324 Oregon Trail
- 3415 Vollmer Rd Unit 308
- 3106 Hermes Dr
- 1833 Pheasant Ct
- 3427 Vollmer Rd Unit 209
- 3521 Park Place
- 2904 Athena Ct
- 2908 Athena Ct
- 20015 Delphi Dr
- 3224 Cumberland Trail
- 3420 203rd St
- 2937 Kathleen Ln
- 3506 Ithaca Rd
- 3013 Mac Heath Crescent
- 1450 Tanglewood St Unit 1B
- 20415 Doria Ln
- 3232 Chestnut Dr
- 3045 Scott Crescent
- 20436 Arcadian Dr
- 20001 Arquilla Cir
- 3219 Oregon Trail
- 3231 Oregon Trail
- 3237 Oregon Trail
- 3230 Oregon Trail
- 3244 Vollmer Rd
- 3228 Vollmer Rd
- 3248 Vollmer Rd
- 3252 Vollmer Rd
- 3238 Oregon Trail
- 3243 Oregon Trail
- 20003 Mohawk Trail
- 20006 Mohawk Trail
- 3212 Vollmer Rd
- 3212 Vollmer Rd
- 3208 Oregon Trail
- 3249 Oregon Trail
- 3244 Oregon Trail
- 20012 Mohawk Trail
- 3322 Vollmer Rd
- 3200 Vollmer Rd