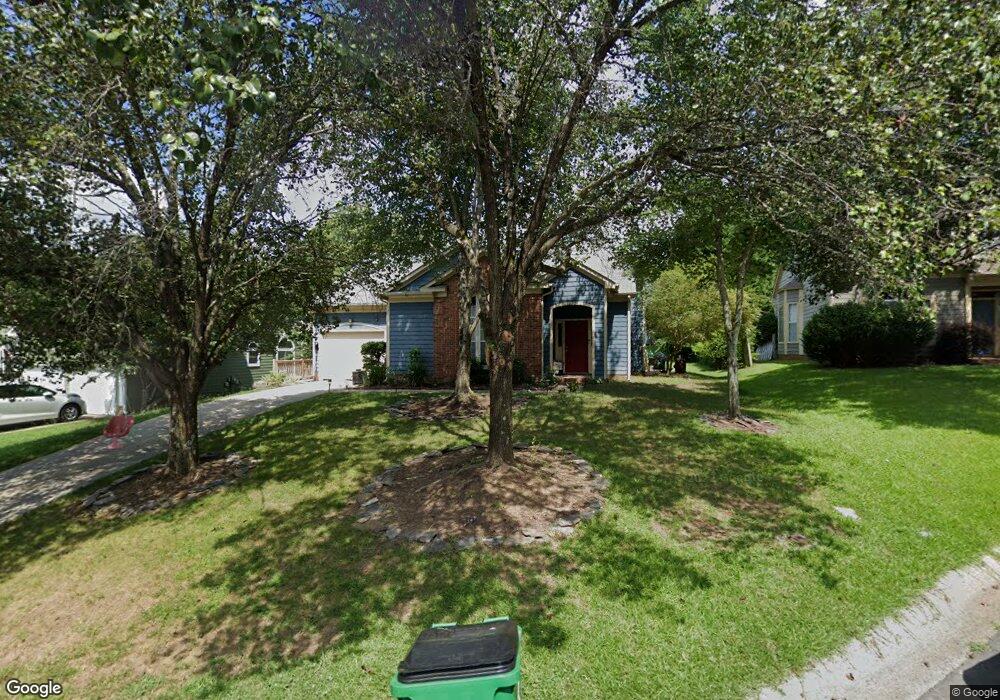
3225 Twin Falls Ln Unit 8 Matthews, NC 28105
Marshbrooke NeighborhoodEstimated Value: $358,061 - $375,000
3
Beds
2
Baths
1,438
Sq Ft
$255/Sq Ft
Est. Value
About This Home
This home is located at 3225 Twin Falls Ln Unit 8, Matthews, NC 28105 and is currently estimated at $366,265, approximately $254 per square foot. 3225 Twin Falls Ln Unit 8 is a home located in Mecklenburg County with nearby schools including Crown Point Elementary, Mint Hill Middle School, and Butler High School.
Ownership History
Date
Name
Owned For
Owner Type
Purchase Details
Closed on
Oct 6, 2023
Sold by
Barnes John Tyler and Barnes Gretchen Danielle
Bought by
Matheos Yohannes and Mehret Tesfalidet Mehret
Current Estimated Value
Purchase Details
Closed on
Feb 29, 2016
Sold by
Esteves Paul and Esteves Denise Beverly
Bought by
Barnes John Tyler and Barnes Gretchen Danielle
Purchase Details
Closed on
Feb 21, 2003
Sold by
Allison Richard E and Allison Susan M
Bought by
Beverly Denise
Home Financials for this Owner
Home Financials are based on the most recent Mortgage that was taken out on this home.
Original Mortgage
$107,000
Interest Rate
5.93%
Mortgage Type
Purchase Money Mortgage
Create a Home Valuation Report for This Property
The Home Valuation Report is an in-depth analysis detailing your home's value as well as a comparison with similar homes in the area
Home Values in the Area
Average Home Value in this Area
Purchase History
| Date | Buyer | Sale Price | Title Company |
|---|---|---|---|
| Matheos Yohannes | $355,000 | None Listed On Document | |
| Barnes John Tyler | $142,000 | None Available | |
| Beverly Denise | $108,000 | -- |
Source: Public Records
Mortgage History
| Date | Status | Borrower | Loan Amount |
|---|---|---|---|
| Previous Owner | Beverly Denise | $107,000 |
Source: Public Records
Tax History Compared to Growth
Tax History
| Year | Tax Paid | Tax Assessment Tax Assessment Total Assessment is a certain percentage of the fair market value that is determined by local assessors to be the total taxable value of land and additions on the property. | Land | Improvement |
|---|---|---|---|---|
| 2025 | $2,663 | $331,400 | $80,000 | $251,400 |
| 2024 | $2,663 | $331,400 | $80,000 | $251,400 |
| 2023 | $2,428 | $312,000 | $80,000 | $232,000 |
| 2022 | $1,919 | $185,800 | $50,000 | $135,800 |
| 2021 | $1,907 | $185,800 | $50,000 | $135,800 |
| 2020 | $1,900 | $185,800 | $50,000 | $135,800 |
| 2019 | $1,885 | $185,800 | $50,000 | $135,800 |
| 2018 | $1,674 | $122,000 | $25,000 | $97,000 |
| 2017 | $1,642 | $122,000 | $25,000 | $97,000 |
| 2016 | $1,633 | $122,000 | $25,000 | $97,000 |
| 2015 | $1,621 | $122,000 | $25,000 | $97,000 |
| 2014 | $1,629 | $122,000 | $25,000 | $97,000 |
Source: Public Records
Map
Nearby Homes
- 8901 Clifton Meadow Dr
- 4028 Grommet Ct
- 4020 Grommet Ct
- 3807 Broomstraw Ct
- 3329 Fortis Ln
- 3012 Longspur Dr
- 8702 Wood Sorrel Ct
- 2803 Old House Cir
- 4013 Grommet Ct
- Hudson Plan at Arbor Village
- Red Oak Plan at Arbor Village
- Kiawah Plan at Arbor Village
- Amberlea Plan at Arbor Village
- 9320 Tibble Creek Way
- 4029 Grommet Ct
- 4032 Grommet Ct
- 4036 Grommet Ct
- 4037 Grommet Ct
- 4040 Grommet Ct
- 4044 Grommet Ct
- 3225 Twin Falls Ln
- 3219 Twin Falls Ln
- 3229 Twin Falls Ln
- 3215 Twin Falls Ln
- 3233 Twin Falls Ln
- 9021 Clifton Meadow Dr
- 9101 Clifton Meadow Dr
- 9017 Clifton Meadow Dr
- 9105 Clifton Meadow Dr
- 3220 Twin Falls Ln
- 3226 Twin Falls Ln
- 3234 Twin Falls Ln
- 9013 Clifton Meadow Dr
- 3209 Twin Falls Ln
- 3216 Twin Falls Ln
- 3304 Chistow Rd
- 3230 Twin Falls Ln
- 9109 Clifton Meadow Dr
- 9009 Clifton Meadow Dr
- 3212 Twin Falls Ln