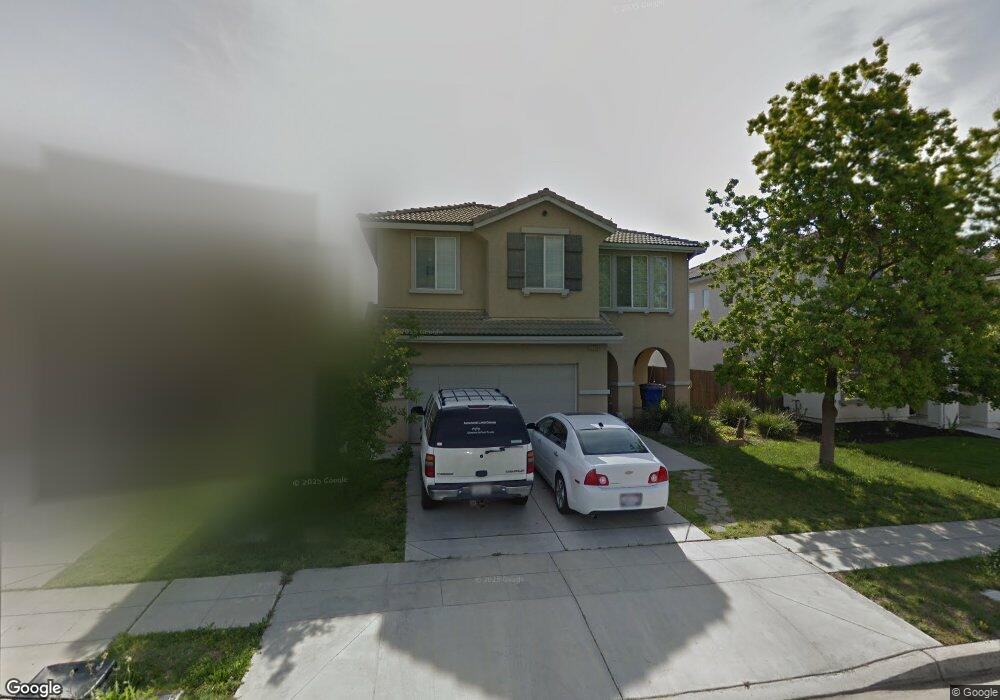
3226 N Applegate Ave Fresno, CA 93737
McLane NeighborhoodEstimated Value: $466,171 - $521,000
3
Beds
3
Baths
1,900
Sq Ft
$254/Sq Ft
Est. Value
About This Home
This home is located at 3226 N Applegate Ave, Fresno, CA 93737 and is currently estimated at $482,793, approximately $254 per square foot. 3226 N Applegate Ave is a home located in Fresno County with nearby schools including Reyburn Intermediate School, Clovis East High School, and Clovis Christian Schools.
Ownership History
Date
Name
Owned For
Owner Type
Purchase Details
Closed on
Apr 21, 2018
Sold by
Annis David
Bought by
Annis Joshua and Annis Crystal E
Current Estimated Value
Purchase Details
Closed on
Apr 5, 2010
Sold by
Deutsche Bank National Company
Bought by
Annis David
Home Financials for this Owner
Home Financials are based on the most recent Mortgage that was taken out on this home.
Original Mortgage
$175,950
Interest Rate
4.94%
Mortgage Type
New Conventional
Purchase Details
Closed on
Nov 17, 2009
Sold by
Madlaing Dionisio and Madlaing Maribel
Bought by
Deutsche Bank National Trust Company
Purchase Details
Closed on
Oct 3, 2006
Sold by
Woodside Saratoga Sales Inc
Bought by
Madlaing Dionisio and Madlaing Maribel
Home Financials for this Owner
Home Financials are based on the most recent Mortgage that was taken out on this home.
Original Mortgage
$329,248
Interest Rate
7.9%
Mortgage Type
Balloon
Create a Home Valuation Report for This Property
The Home Valuation Report is an in-depth analysis detailing your home's value as well as a comparison with similar homes in the area
Home Values in the Area
Average Home Value in this Area
Purchase History
| Date | Buyer | Sale Price | Title Company |
|---|---|---|---|
| Annis Joshua | $304,000 | Chicago Title Company | |
| Annis David | $195,500 | Lsi | |
| Deutsche Bank National Trust Company | $237,838 | Accommodation | |
| Madlaing Dionisio | $347,000 | First American Title Company |
Source: Public Records
Mortgage History
| Date | Status | Borrower | Loan Amount |
|---|---|---|---|
| Previous Owner | Annis David | $175,950 | |
| Previous Owner | Madlaing Dionisio | $329,248 | |
| Closed | Annis Joshua | $0 |
Source: Public Records
Tax History Compared to Growth
Tax History
| Year | Tax Paid | Tax Assessment Tax Assessment Total Assessment is a certain percentage of the fair market value that is determined by local assessors to be the total taxable value of land and additions on the property. | Land | Improvement |
|---|---|---|---|---|
| 2025 | $4,298 | $345,894 | $91,023 | $254,871 |
| 2023 | $4,111 | $332,465 | $87,490 | $244,975 |
| 2022 | $4,045 | $325,947 | $85,775 | $240,172 |
| 2021 | $3,931 | $319,557 | $84,094 | $235,463 |
| 2020 | $3,883 | $316,281 | $83,232 | $233,049 |
| 2019 | $3,811 | $310,080 | $81,600 | $228,480 |
| 2018 | $2,750 | $221,783 | $56,720 | $165,063 |
| 2017 | $2,693 | $217,435 | $55,608 | $161,827 |
| 2016 | $2,606 | $213,172 | $54,518 | $158,654 |
| 2015 | $2,621 | $209,971 | $53,700 | $156,271 |
| 2014 | $2,729 | $205,859 | $52,649 | $153,210 |
Source: Public Records
Map
Nearby Homes
- 7269 E Cortland Ave
- 7369 E Garland Ave
- 7128 E Simpson Ave
- 3083 N Stanley Ave
- 7458 E Robinson Ave
- 2819 N Redda Rd
- 3342 N Carriage Ave
- 3514 Hornet Ave
- 7330 E Princeton Ave
- 2735 N Redda Rd
- 3452 N Triad Ave
- 2872 N Locan Ave
- 3329 N Shelly Ave
- 7063 E Brown Ave
- 2676 N Janice Ave
- 3062 N Filbert Ave
- 3278 Magnolia Ave
- 6406 E Giavanna Ave
- 3253 Joshua Ave
- 2788 N Douglas Ave
- 3212 N Applegate Ave
- 3248 N Applegate Ave
- 3198 N Applegate Ave
- 3227 N Redda Rd
- 3262 N Applegate Ave
- 3241 N Redda Rd
- 3213 N Redda Rd
- 3257 N Redda Rd
- 7074 E Dayton Ave
- 3184 N Applegate Ave
- 3199 N Redda Rd
- 7073 E Redlands Ave
- 3185 N Redda Rd
- 7062 E Dayton Ave
- 3170 N Applegate Ave
- 7049 E Redlands Ave
- 3171 N Redda Rd
- 7106 E Redlands Ave
- 7050 E Dayton Ave
- 7088 E Redlands Ave