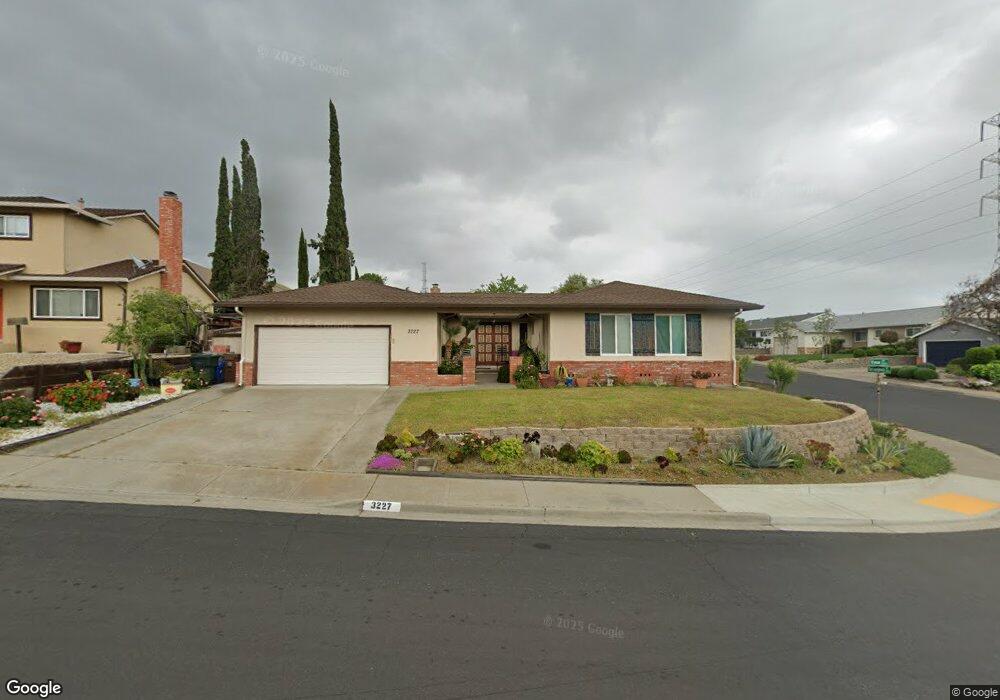
3227 View Dr Antioch, CA 94509
Contra Loma NeighborhoodEstimated Value: $571,541 - $614,000
4
Beds
2
Baths
1,849
Sq Ft
$320/Sq Ft
Est. Value
About This Home
This home is located at 3227 View Dr, Antioch, CA 94509 and is currently estimated at $590,885, approximately $319 per square foot. 3227 View Dr is a home located in Contra Costa County with nearby schools including Sutter Elementary School, Park Middle School, and Antioch High School.
Ownership History
Date
Name
Owned For
Owner Type
Purchase Details
Closed on
Sep 14, 2009
Sold by
Robinson Renee
Bought by
Wan Florence
Current Estimated Value
Purchase Details
Closed on
Nov 3, 2005
Sold by
Davis Melvin Eugene
Bought by
Robinson Renee
Home Financials for this Owner
Home Financials are based on the most recent Mortgage that was taken out on this home.
Original Mortgage
$384,000
Interest Rate
5.9%
Mortgage Type
Stand Alone First
Purchase Details
Closed on
Oct 12, 2005
Sold by
Gregory Jonathan and Gregory Ginger
Bought by
Robinson Renee
Home Financials for this Owner
Home Financials are based on the most recent Mortgage that was taken out on this home.
Original Mortgage
$384,000
Interest Rate
5.9%
Mortgage Type
Stand Alone First
Purchase Details
Closed on
Mar 18, 2002
Sold by
Martinez Hope
Bought by
Martinez Rosendo B
Purchase Details
Closed on
Nov 15, 2001
Sold by
Utter Marguerite
Bought by
Utter Marguerite
Create a Home Valuation Report for This Property
The Home Valuation Report is an in-depth analysis detailing your home's value as well as a comparison with similar homes in the area
Home Values in the Area
Average Home Value in this Area
Purchase History
| Date | Buyer | Sale Price | Title Company |
|---|---|---|---|
| Wan Florence | $175,000 | Old Republic Title Company | |
| Robinson Renee | -- | Chicago Title | |
| Robinson Renee | $480,000 | Chicago Title | |
| Martinez Rosendo B | -- | -- | |
| Utter Marguerite | -- | -- |
Source: Public Records
Mortgage History
| Date | Status | Borrower | Loan Amount |
|---|---|---|---|
| Previous Owner | Robinson Renee | $384,000 |
Source: Public Records
Tax History
| Year | Tax Paid | Tax Assessment Tax Assessment Total Assessment is a certain percentage of the fair market value that is determined by local assessors to be the total taxable value of land and additions on the property. | Land | Improvement |
|---|---|---|---|---|
| 2025 | $3,023 | $225,875 | $58,078 | $167,797 |
| 2024 | $2,853 | $221,447 | $56,940 | $164,507 |
| 2023 | $2,853 | $217,106 | $55,824 | $161,282 |
| 2022 | $2,811 | $212,850 | $54,730 | $158,120 |
| 2021 | $2,700 | $208,677 | $53,657 | $155,020 |
| 2019 | $2,652 | $202,489 | $52,066 | $150,423 |
| 2018 | $2,558 | $198,520 | $51,046 | $147,474 |
| 2017 | $2,488 | $194,629 | $50,046 | $144,583 |
| 2016 | $2,423 | $190,814 | $49,065 | $141,749 |
| 2015 | $2,394 | $187,948 | $48,328 | $139,620 |
| 2014 | $2,320 | $184,268 | $47,382 | $136,886 |
Source: Public Records
Map
Nearby Homes
- 5 Terranova Dr
- 3126 Lone Tree Way
- 9 El Capitan Ln
- 14 El Capitan Ln
- 3613 Longview Rd
- 26 El Capitan Ln
- 108 Fleetwood Dr
- 525 Faria St
- 14 Doral Way
- 3203 Pierce Ct
- 304 Huntington Dr
- 2744 El Rey St
- 2901 Roosevelt Ln
- 4 Wightman Ct
- 412 W Tregallas Rd
- 2709 G St
- 3405 Garrow Dr
- 3366 S Francisco Way
- 4109 S Royal Links Cir
- 224 Cobblestone Dr
- 3223 View Dr
- 40 Terranova Dr
- 3219 View Dr
- 3226 View Dr
- 45 Terranova Dr
- 49 Terranova Dr
- 41 Terranova Dr
- 3220 View Dr
- 101 Terranova Dr
- 3213 View Dr
- 32 Terranova Dr
- 37 Terranova Dr
- 3216 View Dr
- 108 Terranova Dr
- 105 Terranova Dr
- 33 Terranova Dr
- 28 Terranova Dr
- 3212 View Dr
- 100 Clearbrook Rd
- 50 Clearbrook Rd
Your Personal Tour Guide
Ask me questions while you tour the home.