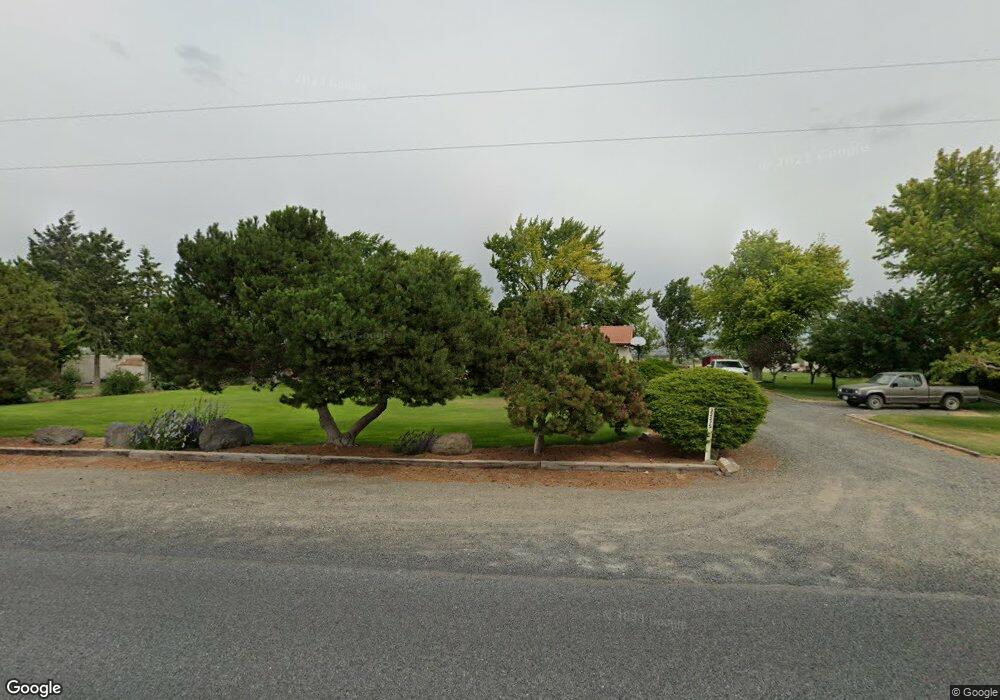
32275 E Loop Rd Hermiston, OR 97838
Estimated Value: $477,000 - $550,000
2
Beds
2
Baths
1,590
Sq Ft
$328/Sq Ft
Est. Value
About This Home
This home is located at 32275 E Loop Rd, Hermiston, OR 97838 and is currently estimated at $521,298, approximately $327 per square foot. 32275 E Loop Rd is a home located in Umatilla County with nearby schools including Desert View Elementary School, Sandstone Middle School, and Hermiston High School.
Ownership History
Date
Name
Owned For
Owner Type
Purchase Details
Closed on
Aug 19, 2013
Sold by
Secretary Of Housing & Urban Development
Bought by
Clayson Shane Paul and Clayson Casey Dawn
Current Estimated Value
Home Financials for this Owner
Home Financials are based on the most recent Mortgage that was taken out on this home.
Original Mortgage
$203,582
Outstanding Balance
$149,796
Interest Rate
4.51%
Mortgage Type
New Conventional
Estimated Equity
$371,502
Purchase Details
Closed on
Sep 14, 2012
Sold by
Renshaw Albert and Renshaw Tina
Bought by
Bank Of America Na
Purchase Details
Closed on
Aug 13, 2008
Sold by
Quantz Laura
Bought by
Renshaw Albert and Renshaw Tina
Home Financials for this Owner
Home Financials are based on the most recent Mortgage that was taken out on this home.
Original Mortgage
$265,500
Interest Rate
6.32%
Mortgage Type
Construction
Create a Home Valuation Report for This Property
The Home Valuation Report is an in-depth analysis detailing your home's value as well as a comparison with similar homes in the area
Purchase History
| Date | Buyer | Sale Price | Title Company |
|---|---|---|---|
| Clayson Shane Paul | $214,297 | Amerititle | |
| Bank Of America Na | $283,308 | Pioneer Title Co | |
| Renshaw Albert | $197,864 | Pioneer Title Co |
Source: Public Records
Mortgage History
| Date | Status | Borrower | Loan Amount |
|---|---|---|---|
| Open | Clayson Shane Paul | $203,582 | |
| Previous Owner | Renshaw Albert | $265,500 |
Source: Public Records
Tax History
| Year | Tax Paid | Tax Assessment Tax Assessment Total Assessment is a certain percentage of the fair market value that is determined by local assessors to be the total taxable value of land and additions on the property. | Land | Improvement |
|---|---|---|---|---|
| 2025 | $4,893 | $325,690 | $75,420 | $250,270 |
| 2023 | $4,787 | $307,000 | $71,090 | $235,910 |
| 2022 | $4,487 | $298,060 | $0 | $0 |
| 2021 | $4,520 | $289,380 | $67,010 | $222,370 |
| 2020 | $4,353 | $280,960 | $65,060 | $215,900 |
| 2018 | $4,253 | $264,840 | $61,320 | $203,520 |
| 2017 | $4,157 | $257,130 | $59,540 | $197,590 |
| 2016 | $4,019 | $249,650 | $57,810 | $191,840 |
| 2015 | $3,827 | $228,480 | $52,890 | $175,590 |
| 2014 | $3,548 | $228,480 | $52,890 | $175,590 |
Source: Public Records
Map
Nearby Homes
- 000 Leather
- 1437 E Hurlburt Ave
- 1440 NE Misty Dr
- 113 NE 13th St
- 1322 NE Gillespie Ln
- 32215 Baxter Rd
- 32255 Baxter Rd
- 1115 E Hurlburt Ave
- 188 NE 11th St
- 1129 NE Emerald Dr
- 1075 NE Emerald Dr
- 872 E Kinsley Ave
- 885 E Kinsley Ave
- 873 E Kinsley Ave
- 876 E Kinsley Ave
- 1073 NE Emerald Dr
- 994 E Hurlburt Ave
- 1044 NE Emerald Dr
- 1143 SE Owyn Dr
- 1120 SE Owyn Dr
- 32281 E Loop Rd
- 32285 E Loop Rd
- 32287 E Loop Rd
- 79576 Brown Ln
- 32289 E Loop Rd
- 32293 E Loop Rd
- 79555 Brown Ln
- 32308 E Loop Rd
- 32207 Springhill Ln
- 32301 E Loop Rd
- 32310 E Loop Rd
- 32201 E Highland Extension
- 175 N Ott Rd
- 32311 E Loop Rd
- 32313 E Loop Rd
- 32305 Springhill Ln
- 32312 E Loop Rd
- 32341 E Loop Rd
- 591 N Ott Rd
- 32306 Benjamin Ln
Your Personal Tour Guide
Ask me questions while you tour the home.