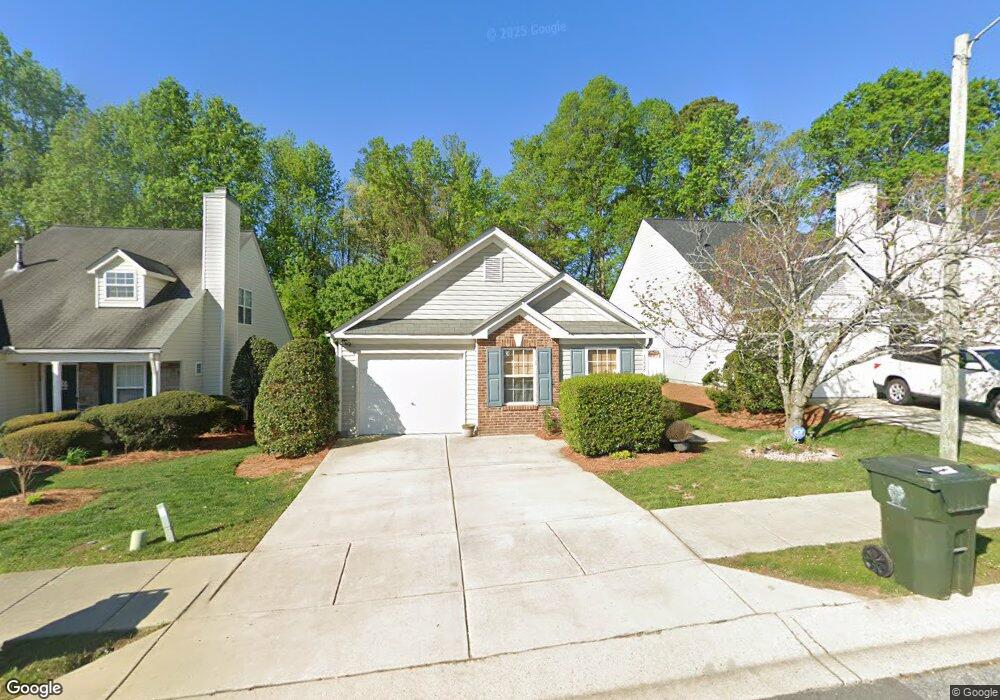
3228 Marcony Way Raleigh, NC 27610
Southeast Raleigh NeighborhoodEstimated Value: $275,685 - $305,000
3
Beds
2
Baths
1,195
Sq Ft
$246/Sq Ft
Est. Value
About This Home
This home is located at 3228 Marcony Way, Raleigh, NC 27610 and is currently estimated at $293,421, approximately $245 per square foot. 3228 Marcony Way is a home located in Wake County with nearby schools including Barwell Road Elementary School, East Garner Middle School, and South Garner High.
Ownership History
Date
Name
Owned For
Owner Type
Purchase Details
Closed on
Mar 15, 2018
Sold by
Opendoor Homes Phoenix 2 Llc
Bought by
Thompson Jennifer and Thompson Sharif K
Current Estimated Value
Home Financials for this Owner
Home Financials are based on the most recent Mortgage that was taken out on this home.
Original Mortgage
$156,000
Outstanding Balance
$135,194
Interest Rate
4.87%
Mortgage Type
Adjustable Rate Mortgage/ARM
Estimated Equity
$158,227
Purchase Details
Closed on
Jan 12, 2018
Sold by
Miler Christian J and Miler Joanne S
Bought by
Opendoor Homes Phoenix 2 Llc
Purchase Details
Closed on
Aug 23, 2002
Sold by
Colony Homes Llc
Bought by
Miller Christian J and Miller Joanne S
Home Financials for this Owner
Home Financials are based on the most recent Mortgage that was taken out on this home.
Original Mortgage
$94,041
Interest Rate
6.49%
Mortgage Type
FHA
Create a Home Valuation Report for This Property
The Home Valuation Report is an in-depth analysis detailing your home's value as well as a comparison with similar homes in the area
Home Values in the Area
Average Home Value in this Area
Purchase History
| Date | Buyer | Sale Price | Title Company |
|---|---|---|---|
| Thompson Jennifer | $154,000 | None Available | |
| Opendoor Homes Phoenix 2 Llc | $136,000 | None Available | |
| Miller Christian J | $95,000 | -- |
Source: Public Records
Mortgage History
| Date | Status | Borrower | Loan Amount |
|---|---|---|---|
| Open | Thompson Jennifer | $156,000 | |
| Previous Owner | Miller Christian J | $94,041 | |
| Closed | Opendoor Homes Phoenix 2 Llc | $0 |
Source: Public Records
Tax History Compared to Growth
Tax History
| Year | Tax Paid | Tax Assessment Tax Assessment Total Assessment is a certain percentage of the fair market value that is determined by local assessors to be the total taxable value of land and additions on the property. | Land | Improvement |
|---|---|---|---|---|
| 2025 | $2,142 | $243,352 | $70,000 | $173,352 |
| 2024 | $2,134 | $243,352 | $70,000 | $173,352 |
| 2023 | $1,728 | $156,734 | $37,000 | $119,734 |
| 2022 | $1,607 | $156,734 | $37,000 | $119,734 |
| 2021 | $1,545 | $156,734 | $37,000 | $119,734 |
| 2020 | $1,517 | $156,734 | $37,000 | $119,734 |
| 2019 | $1,415 | $120,374 | $28,000 | $92,374 |
| 2018 | $1,335 | $120,374 | $28,000 | $92,374 |
| 2017 | $1,272 | $120,374 | $28,000 | $92,374 |
| 2016 | $1,246 | $120,374 | $28,000 | $92,374 |
| 2015 | $1,326 | $126,132 | $34,000 | $92,132 |
| 2014 | $1,258 | $126,132 | $34,000 | $92,132 |
Source: Public Records
Map
Nearby Homes
- 5808 Carretta Ct
- 3316 Perkins Ridge Rd
- 5612 Tealbrook Dr
- 5512 Quitman Trail
- 3205 Vallejo Trail
- 2601 Baxley Dr
- 6420 Hatchies Dr
- 2700 Barrington Dr
- 5600 Brandycrest Dr
- 5849 Ricker Rd
- 5305 Tomahawk Trail
- 6005 Namozine Ct
- 6863 Paint Rock Ln
- 6520 Bunker Hill Dr
- 2425 Abbeyhill Dr Unit 10
- 6408 Bunker Hill Dr
- 6037 Sodium St
- 4342 Bay Rum Ln
- 6017 Sodium St
- 3920 Cane Garden Dr
- 3232 Marcony Way
- 3224 Marcony Way
- 3236 Marcony Way
- 3220 Marcony Way
- 3240 Marcony Way
- 3216 Marcony Way
- 5837 Cherryrain Ct
- 5836 Cherryrain Ct
- 3242 Marcony Way
- 3212 Marcony Way
- 5833 Cherryrain Ct
- 5832 Cherryrain Ct
- 3208 Marcony Way
- 5829 Cherryrain Ct
- 5828 Cherryrain Ct
- 3246 Marcony Way
- 3129 Marshlane Way
- 3075 Bracey Place
- 3125 Marshlane Way
- 3204 Marcony Way