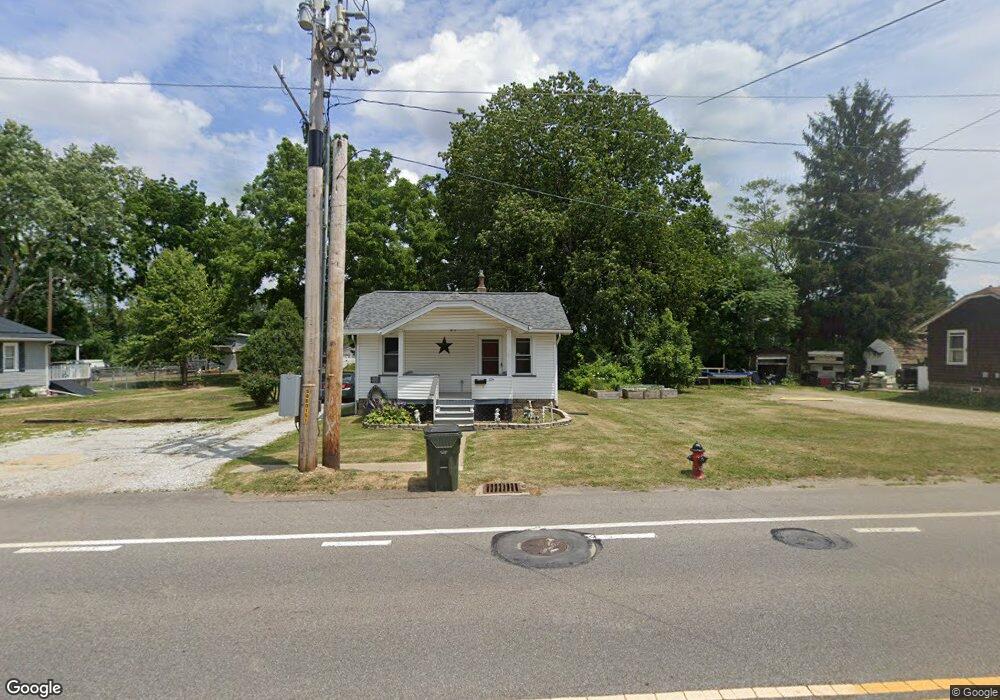
3228 Middlebranch Ave NE Canton, OH 44705
Plain Township NeighborhoodEstimated Value: $116,000 - $179,000
3
Beds
1
Bath
1,156
Sq Ft
$133/Sq Ft
Est. Value
About This Home
This home is located at 3228 Middlebranch Ave NE, Canton, OH 44705 and is currently estimated at $153,816, approximately $133 per square foot. 3228 Middlebranch Ave NE is a home located in Stark County with nearby schools including Ransom H. Barr Elementary School, Glenwood Intermediate School, and GlenOak High School.
Ownership History
Date
Name
Owned For
Owner Type
Purchase Details
Closed on
Oct 5, 2012
Sold by
Mccalla Marketing Inc
Bought by
Marjoan Properties Llc
Current Estimated Value
Purchase Details
Closed on
Oct 18, 2007
Sold by
Fannie Mae
Bought by
Mccalla Marilyn L
Purchase Details
Closed on
Sep 21, 2007
Sold by
Flickinger Van S
Bought by
Federal National Mortgage Association
Purchase Details
Closed on
Dec 15, 2003
Sold by
Manufacturers & Traders Trust Co
Bought by
Flickinger Van S
Home Financials for this Owner
Home Financials are based on the most recent Mortgage that was taken out on this home.
Original Mortgage
$41,250
Interest Rate
6.03%
Mortgage Type
Purchase Money Mortgage
Purchase Details
Closed on
Aug 28, 2003
Sold by
Coss James R
Bought by
Manufacturers & Traders Trust Co and Securitization Series 1999-3 Agreement
Create a Home Valuation Report for This Property
The Home Valuation Report is an in-depth analysis detailing your home's value as well as a comparison with similar homes in the area
Home Values in the Area
Average Home Value in this Area
Purchase History
| Date | Buyer | Sale Price | Title Company |
|---|---|---|---|
| Marjoan Properties Llc | $25,000 | None Available | |
| Mccalla Marilyn L | $25,000 | Attorney | |
| Federal National Mortgage Association | $38,000 | None Available | |
| Flickinger Van S | $55,000 | Sovereign Title Agency Llc | |
| Manufacturers & Traders Trust Co | $42,000 | -- |
Source: Public Records
Mortgage History
| Date | Status | Borrower | Loan Amount |
|---|---|---|---|
| Previous Owner | Flickinger Van S | $41,250 |
Source: Public Records
Tax History Compared to Growth
Tax History
| Year | Tax Paid | Tax Assessment Tax Assessment Total Assessment is a certain percentage of the fair market value that is determined by local assessors to be the total taxable value of land and additions on the property. | Land | Improvement |
|---|---|---|---|---|
| 2025 | -- | $35,430 | $12,780 | $22,650 |
| 2024 | -- | $35,430 | $12,780 | $22,650 |
| 2023 | $1,257 | $26,360 | $7,700 | $18,660 |
| 2022 | $1,265 | $26,360 | $7,700 | $18,660 |
| 2021 | $1,271 | $26,360 | $7,700 | $18,660 |
| 2020 | $1,198 | $22,580 | $6,650 | $15,930 |
| 2019 | $1,189 | $22,580 | $6,650 | $15,930 |
| 2018 | $1,175 | $22,580 | $6,650 | $15,930 |
| 2017 | $1,155 | $20,480 | $6,020 | $14,460 |
Source: Public Records
Map
Nearby Homes
- 3022 Taft Ave NE
- 1644 33rd St NE
- 2017 28th St NE
- 1601 33rd St NE
- 3305 Regent Ave NE
- 1902 39th St NE
- 1428 35th St NE
- 0 St Elmo Ave NE Unit 5159780
- 0 St Elmo Ave NE Unit 5089961
- 1912 40th St NE
- 1638 Warrick Place NE
- 3606 Rowland Ave NE
- 1306 Milford St NE
- 1610 Colonial Blvd NE
- 3619 Rowland Ave NE
- 2314 24th St NE
- 4015 Pelham St NE Unit 3A
- 000 Rowland Ave NE
- 1417 Colonial Blvd NE
- 2310 Maple Ave NE
- 3300 Middlebranch Ave NE
- 3304 Middlebranch Ave NE
- 3220 Middlebranch Ave NE
- 3220 Middlebranch Ave NE
- 3214 Middlebranch Ave NE
- 0 Middlebranch Ave NE Unit 3781839
- 0 Middlebranch Ave NE Unit 4461249
- 3210 Middlebranch Ave NE
- 3312 Middlebranch Ave NE
- 3225 Middlebranch Ave NE
- 3229 Roosevelt Ave NE
- 3233 Roosevelt Ave NE
- 2120 34th St NE
- 3221 Roosevelt Ave NE
- 3305 Roosevelt Ave NE
- 3303 Middlebranch Ave NE
- 3316 Middlebranch Ave NE
- 3215 Roosevelt Ave NE
- 2124 34th St NE
- 3315 Middlebranch Ave NE