Estimated Value: $1,555,943 - $1,991,000
3
Beds
3
Baths
1,824
Sq Ft
$962/Sq Ft
Est. Value
About This Home
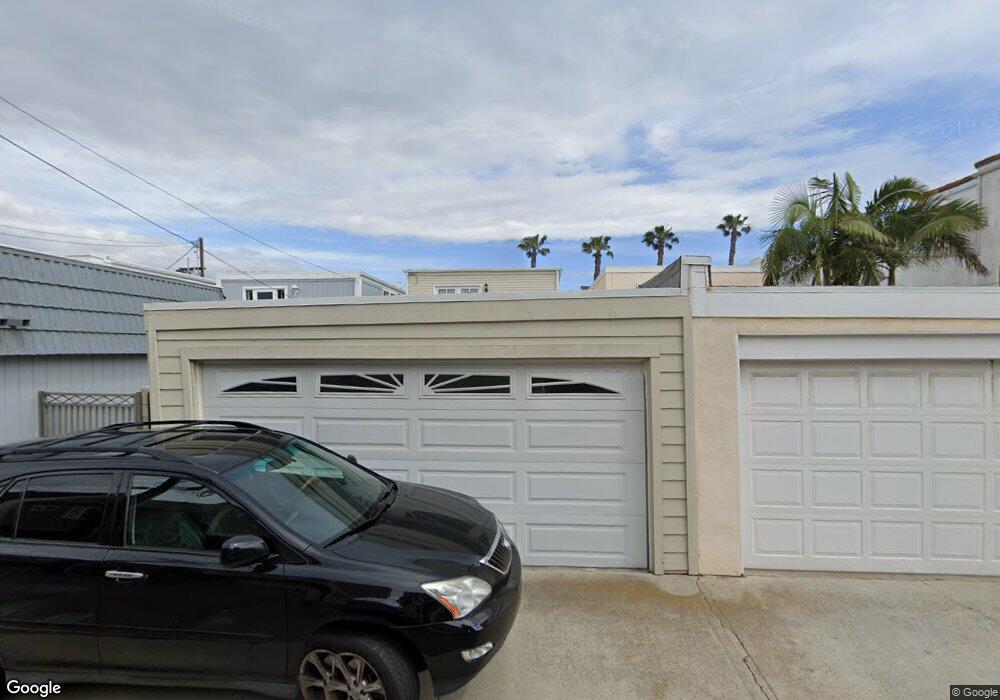
This home is located at 323 17th St, Huntington Beach, CA 92648 and is currently estimated at $1,754,986, approximately $962 per square foot. 323 17th St is a home located in Orange County with nearby schools including Agnes L. Smith Elementary, Ethel Dwyer Middle, and Huntington Beach High School.
Ownership History
Date
Name
Owned For
Owner Type
Purchase Details
Closed on
Jun 26, 2020
Sold by
Clay Jack Starnes and Clay Jack Starnes
Bought by
Clay Jack Starnes and 2020 Jack Starnes
Current Estimated Value
Purchase Details
Closed on
Mar 19, 2012
Sold by
Clay Jack Starnes and Clay Ok Pun
Bought by
Clay Jack Starnes and Clay Ok Pun
Purchase Details
Closed on
Feb 1, 1995
Sold by
Lynch Merrill
Bought by
Lynch Merrill
Home Financials for this Owner
Home Financials are based on the most recent Mortgage that was taken out on this home.
Original Mortgage
$221,500
Interest Rate
9.2%
Purchase Details
Closed on
Dec 16, 1994
Sold by
Merrill Lynch Credit Corp
Bought by
Clay Jack Starnes and Clay Ok Pun
Home Financials for this Owner
Home Financials are based on the most recent Mortgage that was taken out on this home.
Original Mortgage
$221,500
Interest Rate
9.2%
Create a Home Valuation Report for This Property
The Home Valuation Report is an in-depth analysis detailing your home's value as well as a comparison with similar homes in the area
Home Values in the Area
Average Home Value in this Area
Purchase History
| Date | Buyer | Sale Price | Title Company |
|---|---|---|---|
| Clay Jack Starnes | -- | None Available | |
| Clay Jack Starnes | -- | None Available | |
| Lynch Merrill | $198,608 | -- | |
| Clay Jack Starnes | $281,500 | South Coast Title Company |
Source: Public Records
Mortgage History
| Date | Status | Borrower | Loan Amount |
|---|---|---|---|
| Previous Owner | Clay Jack Starnes | $221,500 |
Source: Public Records
Tax History Compared to Growth
Tax History
| Year | Tax Paid | Tax Assessment Tax Assessment Total Assessment is a certain percentage of the fair market value that is determined by local assessors to be the total taxable value of land and additions on the property. | Land | Improvement |
|---|---|---|---|---|
| 2025 | $6,162 | $540,984 | $281,781 | $259,203 |
| 2024 | $6,162 | $530,377 | $276,256 | $254,121 |
| 2023 | $6,022 | $519,978 | $270,839 | $249,139 |
| 2022 | $5,863 | $509,783 | $265,529 | $244,254 |
| 2021 | $5,115 | $441,420 | $260,322 | $181,098 |
| 2020 | $5,080 | $436,894 | $257,652 | $179,242 |
| 2019 | $5,020 | $428,328 | $252,600 | $175,728 |
| 2018 | $4,942 | $419,930 | $247,647 | $172,283 |
| 2017 | $4,875 | $411,697 | $242,792 | $168,905 |
| 2016 | $4,662 | $403,625 | $238,031 | $165,594 |
| 2015 | $4,615 | $397,563 | $234,456 | $163,107 |
| 2014 | $4,518 | $389,776 | $229,864 | $159,912 |
Source: Public Records
Map
Nearby Homes
- 304 18th St
- 306 17th St
- 302 18th St
- 419 18th St
- 505 17th St
- 521 18th St
- 412 20th St
- 416 15th St
- 125 16th St
- 319 14th St Unit B
- 413 14th St Unit D
- 1516 Pacific Coast Hwy Unit 101
- 1400 Pacific Coast Hwy Unit 305
- 627 19th St
- 2000 Pacific Coast Hwy Unit 313
- 2000 Pacific Coast Hwy Unit 103
- 2000 Pacific Coast Hwy Unit 309
- 411 22nd St
- 613 13th St
- 304 Goldenwest St