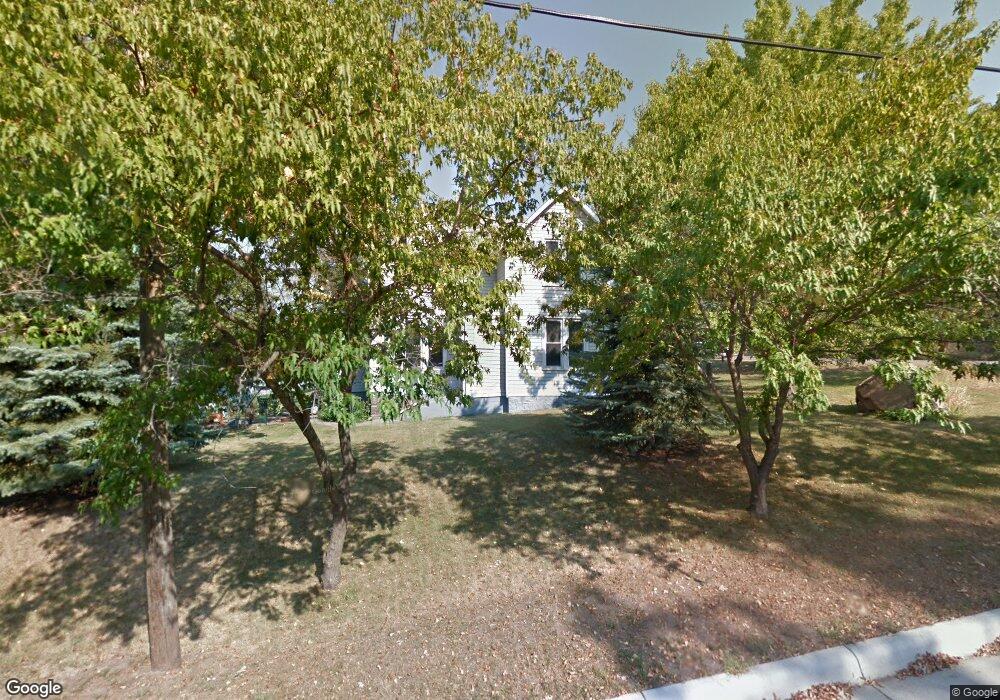
323 2nd St S Sauk Rapids, MN 56379
Estimated Value: $227,287 - $250,000
3
Beds
2
Baths
1,761
Sq Ft
$136/Sq Ft
Est. Value
About This Home
This home is located at 323 2nd St S, Sauk Rapids, MN 56379 and is currently estimated at $239,322, approximately $135 per square foot. 323 2nd St S is a home located in Benton County with nearby schools including Mississippi Heights Elementary School, Sauk Rapids-Rice Middle School, and Sauk Rapids-Rice Senior High School.
Ownership History
Date
Name
Owned For
Owner Type
Purchase Details
Closed on
Dec 23, 2019
Sold by
Wieber Meaghan E
Bought by
Munroe Christopher Alexander and Senart Hutchins Naomi Rose
Current Estimated Value
Home Financials for this Owner
Home Financials are based on the most recent Mortgage that was taken out on this home.
Original Mortgage
$152,108
Outstanding Balance
$134,393
Interest Rate
3.6%
Mortgage Type
Stand Alone First
Estimated Equity
$104,929
Create a Home Valuation Report for This Property
The Home Valuation Report is an in-depth analysis detailing your home's value as well as a comparison with similar homes in the area
Home Values in the Area
Average Home Value in this Area
Purchase History
| Date | Buyer | Sale Price | Title Company |
|---|---|---|---|
| Munroe Christopher Alexander | $157,500 | Stearns Cnty Abstract & Ttl |
Source: Public Records
Mortgage History
| Date | Status | Borrower | Loan Amount |
|---|---|---|---|
| Open | Munroe Christopher Alexander | $152,108 | |
| Closed | Munroe Christopher Alexander | $152,108 |
Source: Public Records
Tax History Compared to Growth
Tax History
| Year | Tax Paid | Tax Assessment Tax Assessment Total Assessment is a certain percentage of the fair market value that is determined by local assessors to be the total taxable value of land and additions on the property. | Land | Improvement |
|---|---|---|---|---|
| 2025 | $2,158 | $200,500 | $28,800 | $171,700 |
| 2024 | $2,414 | $192,900 | $28,800 | $164,100 |
| 2023 | $2,150 | $200,500 | $28,800 | $171,700 |
| 2022 | $1,884 | $178,600 | $26,200 | $152,400 |
| 2021 | $1,898 | $147,800 | $26,200 | $121,600 |
| 2018 | $2,452 | $100,900 | $20,069 | $80,831 |
| 2017 | $2,452 | $93,300 | $19,626 | $73,674 |
| 2016 | $2,462 | $118,300 | $25,200 | $93,100 |
| 2015 | $2,486 | $84,300 | $19,053 | $65,247 |
| 2014 | -- | $78,700 | $18,639 | $60,061 |
| 2013 | -- | $81,000 | $18,813 | $62,187 |
Source: Public Records
Map
Nearby Homes
- 112 Summit Ave S
- 117 6th Ave N
- 608 Summit Ave S
- 100 9th Ave S
- 216 8th Ave N
- 1804 8th Ave S
- 1803 8th Ave S
- 615 3rd Ave N
- 2021 Hillcrest Dr
- 1021 5th St S
- 1011 Water Ave S
- 3300 321st St
- 1 Skyview Dr
- 3322 321st St
- 1715 Hillcrest Rd
- 224 9th St N
- 2161 Mill Pond Dr
- 1209 Millstone Ct
- 2016 Forest Ct
- 2024 Forest Ct