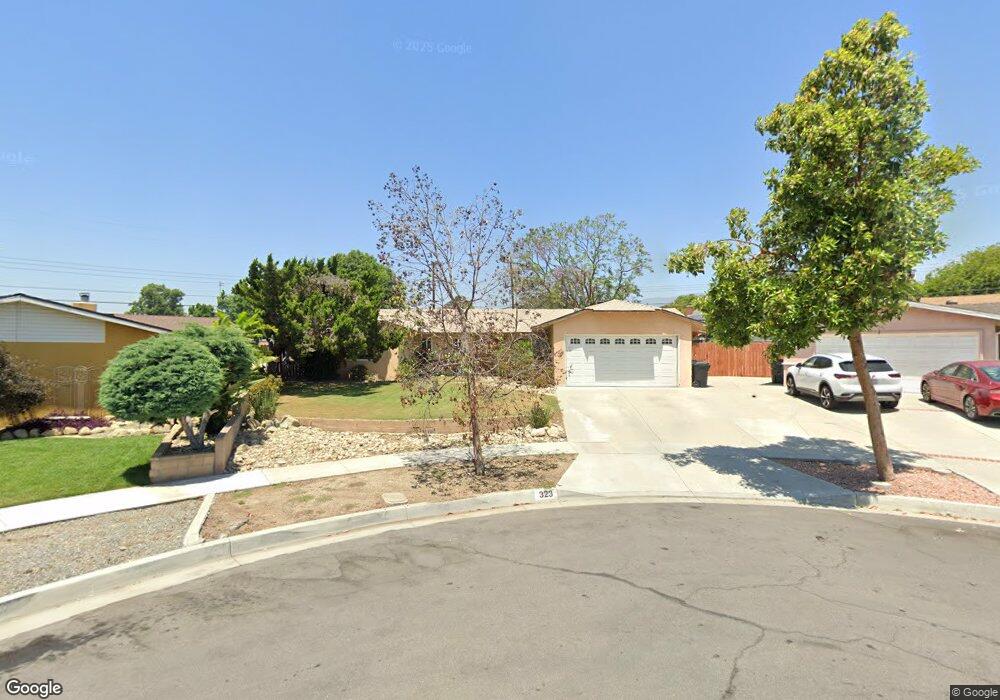
323 Bixby Way Upland, CA 91786
Estimated Value: $754,000 - $821,000
4
Beds
2
Baths
2,048
Sq Ft
$384/Sq Ft
Est. Value
About This Home
This home is located at 323 Bixby Way, Upland, CA 91786 and is currently estimated at $785,440, approximately $383 per square foot. 323 Bixby Way is a home located in San Bernardino County with nearby schools including Citrus Elementary, Upland Junior High School, and Upland High School.
Ownership History
Date
Name
Owned For
Owner Type
Purchase Details
Closed on
Mar 21, 2022
Sold by
Angeles Aguda Fay
Bought by
Aguda Fay Angeles and Nicolas Rosario G
Current Estimated Value
Purchase Details
Closed on
Mar 18, 2022
Sold by
Avancena Nicolas Angelito
Bought by
Nicolas Rosario G
Purchase Details
Closed on
Oct 3, 2013
Sold by
Fey Angeles Aguda Fay
Bought by
Angeles Aguda Fay
Home Financials for this Owner
Home Financials are based on the most recent Mortgage that was taken out on this home.
Original Mortgage
$258,000
Interest Rate
4.55%
Mortgage Type
New Conventional
Purchase Details
Closed on
Jun 19, 1995
Sold by
Hamlin Larry R
Bought by
Angeles Fay
Home Financials for this Owner
Home Financials are based on the most recent Mortgage that was taken out on this home.
Original Mortgage
$150,100
Interest Rate
7.92%
Purchase Details
Closed on
Jan 12, 1995
Sold by
Ba Properties Inc
Bought by
Hamlin Larry R
Purchase Details
Closed on
May 27, 1994
Sold by
Provident Financial Corp
Bought by
Ba Properties Inc
Create a Home Valuation Report for This Property
The Home Valuation Report is an in-depth analysis detailing your home's value as well as a comparison with similar homes in the area
Home Values in the Area
Average Home Value in this Area
Purchase History
| Date | Buyer | Sale Price | Title Company |
|---|---|---|---|
| Aguda Fay Angeles | -- | None Listed On Document | |
| Nicolas Rosario G | -- | Provident Title | |
| Angeles Aguda Fay | -- | Lawyers Title | |
| Aguda Fay Angeles | -- | Lawyers Title | |
| Angeles Fay | $158,000 | Commonwealth Title | |
| Hamlin Larry R | $105,000 | Commonwealth Land Title | |
| Ba Properties Inc | $132,000 | Commonwealth Land Title Co |
Source: Public Records
Mortgage History
| Date | Status | Borrower | Loan Amount |
|---|---|---|---|
| Previous Owner | Aguda Fay Angeles | $258,000 | |
| Previous Owner | Angeles Fay | $150,100 |
Source: Public Records
Tax History
| Year | Tax Paid | Tax Assessment Tax Assessment Total Assessment is a certain percentage of the fair market value that is determined by local assessors to be the total taxable value of land and additions on the property. | Land | Improvement |
|---|---|---|---|---|
| 2025 | $3,054 | $265,392 | $92,384 | $173,008 |
| 2024 | $2,958 | $260,189 | $90,573 | $169,616 |
| 2023 | $2,912 | $255,087 | $88,797 | $166,290 |
| 2022 | $2,849 | $250,085 | $87,056 | $163,029 |
| 2021 | $2,843 | $245,181 | $85,349 | $159,832 |
| 2020 | $2,766 | $242,667 | $84,474 | $158,193 |
| 2019 | $2,757 | $237,909 | $82,818 | $155,091 |
| 2018 | $2,692 | $233,244 | $81,194 | $152,050 |
| 2017 | $2,666 | $228,671 | $79,602 | $149,069 |
| 2016 | $2,425 | $224,187 | $78,041 | $146,146 |
| 2015 | $2,370 | $220,820 | $76,869 | $143,951 |
| 2014 | $2,402 | $216,494 | $75,363 | $141,131 |
Source: Public Records
Map
Nearby Homes
- 306 S Vallejo Way
- 428 W 8th St
- 1550 N Bonita Ct
- 814 W Bonnie Brae Ct
- 340 W Caroline Ct
- 333 White Ave
- 822 W 5th St
- 858 W Yale St
- 296 S Laurel Ave
- 345 Euclid Place
- 435 W 9th St Unit B3
- 1436 N Elderberry Ave
- 1399 Fredericks Ln
- 134 Coral Way
- 1443 Fredericks Ln
- 595 Juniper Ave
- 1446 N Gardenia Ave
- 126 Irving Way
- 633 Maple Way
- 617 N Ukiah Way
- 320 Bixby Way
- 331 Bixby Way
- 892 Bennington St
- 904 Bennington St
- 880 Bennington St
- 324 Bixby Way
- 343 Bixby Way
- 912 Bennington St
- 874 Bennington St
- 332 Bixby Way
- 922 Bennington St
- 338 Bixby Way
- 349 Bixby Way
- 864 Bennington St
- 311 Austin Way
- 319 Austin Way
- 352 Bixby Way
- 265 Bedford Way
- 928 Bennington St
- 335 Austin Way
Your Personal Tour Guide
Ask me questions while you tour the home.