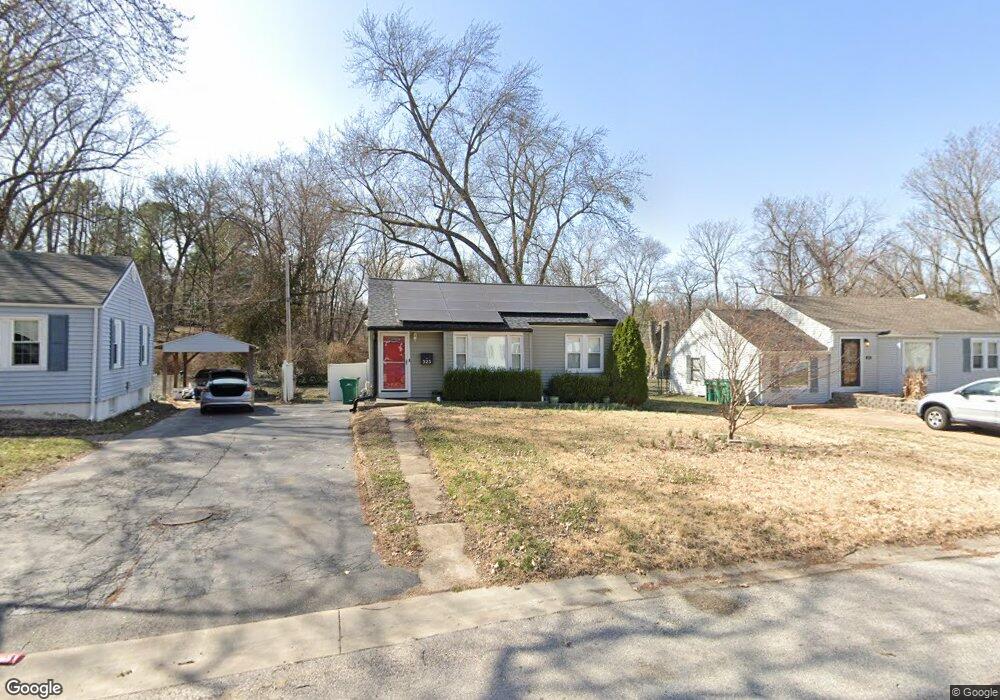
323 Corona Ct Saint Louis, MO 63119
Estimated Value: $192,000 - $290,000
2
Beds
1
Bath
845
Sq Ft
$298/Sq Ft
Est. Value
About This Home
This home is located at 323 Corona Ct, Saint Louis, MO 63119 and is currently estimated at $252,164, approximately $298 per square foot. 323 Corona Ct is a home located in St. Louis County with nearby schools including Avery Elementary School, Hixson Middle School, and Webster Groves High School.
Ownership History
Date
Name
Owned For
Owner Type
Purchase Details
Closed on
Aug 2, 2013
Sold by
Vaninger Micah and Vaninger Tracy
Bought by
Houston Grant and Houston Jennifer
Current Estimated Value
Home Financials for this Owner
Home Financials are based on the most recent Mortgage that was taken out on this home.
Original Mortgage
$96,000
Outstanding Balance
$71,249
Interest Rate
4.34%
Mortgage Type
New Conventional
Estimated Equity
$180,915
Purchase Details
Closed on
Mar 28, 2013
Sold by
Secretary Of Housing & Urban Development
Bought by
Vaninger Micah and Vaninger Tracy
Home Financials for this Owner
Home Financials are based on the most recent Mortgage that was taken out on this home.
Original Mortgage
$67,200
Interest Rate
3.59%
Mortgage Type
Construction
Purchase Details
Closed on
Dec 4, 2012
Sold by
Wells Fargo Bank Na
Bought by
Secretary Of Housing & Urban Development
Purchase Details
Closed on
Jun 28, 2012
Sold by
Taylor Evelyn
Bought by
Wells Fargo Bank Na
Create a Home Valuation Report for This Property
The Home Valuation Report is an in-depth analysis detailing your home's value as well as a comparison with similar homes in the area
Home Values in the Area
Average Home Value in this Area
Purchase History
| Date | Buyer | Sale Price | Title Company |
|---|---|---|---|
| Houston Grant | $120,000 | Continental Title Company | |
| Vaninger Micah | $59,000 | None Available | |
| Secretary Of Housing & Urban Development | $182,939 | None Available | |
| Wells Fargo Bank Na | $182,939 | None Available |
Source: Public Records
Mortgage History
| Date | Status | Borrower | Loan Amount |
|---|---|---|---|
| Open | Houston Grant | $96,000 | |
| Previous Owner | Vaninger Micah | $67,200 |
Source: Public Records
Tax History Compared to Growth
Tax History
| Year | Tax Paid | Tax Assessment Tax Assessment Total Assessment is a certain percentage of the fair market value that is determined by local assessors to be the total taxable value of land and additions on the property. | Land | Improvement |
|---|---|---|---|---|
| 2025 | $2,840 | $46,000 | $33,100 | $12,900 |
| 2024 | $2,840 | $40,470 | $26,490 | $13,980 |
| 2023 | $2,826 | $40,470 | $26,490 | $13,980 |
| 2022 | $2,486 | $32,990 | $26,490 | $6,500 |
| 2021 | $2,478 | $32,990 | $26,490 | $6,500 |
| 2020 | $2,543 | $31,560 | $26,490 | $5,070 |
| 2019 | $2,525 | $31,560 | $26,490 | $5,070 |
| 2018 | $2,443 | $27,100 | $20,600 | $6,500 |
| 2017 | $2,427 | $27,100 | $20,600 | $6,500 |
| 2016 | $2,152 | $22,990 | $14,710 | $8,280 |
| 2015 | $2,153 | $22,990 | $14,710 | $8,280 |
| 2014 | -- | $20,060 | $9,670 | $10,390 |
Source: Public Records
Map
Nearby Homes
- 112 Oakwood Ave
- 546 Holland Ave
- 617 N Elm Ave
- 136 N Gore Ave
- 441 Park Rd
- 218 Euclid Ave
- 814 Holland Ave
- 827 Cornell Ave
- 336 Madison Ave
- 610 Cornelia Ave
- 901 Ennis Ave
- 330 Lithia Ave
- 404 W Kirkham Ave
- 450 E Lockwood Ave Unit 303
- 1013 Bell Ave
- 426 W Kirkham Ave
- 619 N Bompart Ave
- 529 Cyril Dr
- 156 Gray Ave
- 2918 Wingate Ct