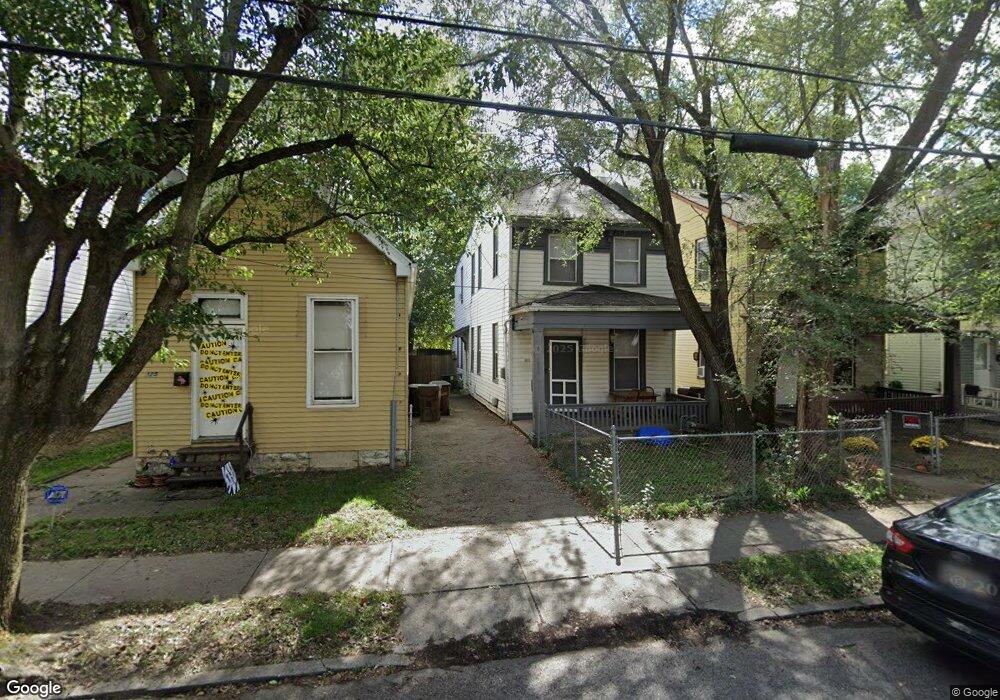
323 E 16th St Covington, KY 41014
Austinburg NeighborhoodEstimated Value: $151,756 - $185,000
3
Beds
2
Baths
1,360
Sq Ft
$125/Sq Ft
Est. Value
About This Home
This home is located at 323 E 16th St, Covington, KY 41014 and is currently estimated at $170,439, approximately $125 per square foot. 323 E 16th St is a home located in Kenton County with nearby schools including Holmes High School, Saint Augustine Catholic School, and Covington Latin School.
Ownership History
Date
Name
Owned For
Owner Type
Purchase Details
Closed on
Aug 31, 2012
Sold by
Fannie Mae
Bought by
Sandals Llc
Current Estimated Value
Purchase Details
Closed on
May 14, 2012
Sold by
Scott Mark and Liggett Scott Sherri R
Bought by
Federal National Mortgage Association
Purchase Details
Closed on
Feb 8, 2007
Sold by
Ballard Mark S and Ballard Kimberly D
Bought by
Scott Mark
Home Financials for this Owner
Home Financials are based on the most recent Mortgage that was taken out on this home.
Original Mortgage
$55,000
Interest Rate
6.08%
Mortgage Type
Purchase Money Mortgage
Create a Home Valuation Report for This Property
The Home Valuation Report is an in-depth analysis detailing your home's value as well as a comparison with similar homes in the area
Home Values in the Area
Average Home Value in this Area
Purchase History
| Date | Buyer | Sale Price | Title Company |
|---|---|---|---|
| Sandals Llc | $11,150 | None Available | |
| Federal National Mortgage Association | $23,334 | None Available | |
| Scott Mark | $30,000 | None Available |
Source: Public Records
Mortgage History
| Date | Status | Borrower | Loan Amount |
|---|---|---|---|
| Previous Owner | Scott Mark | $55,000 |
Source: Public Records
Tax History
| Year | Tax Paid | Tax Assessment Tax Assessment Total Assessment is a certain percentage of the fair market value that is determined by local assessors to be the total taxable value of land and additions on the property. | Land | Improvement |
|---|---|---|---|---|
| 2025 | $716 | $54,000 | $5,000 | $49,000 |
| 2024 | $710 | $54,000 | $5,000 | $49,000 |
| 2023 | $719 | $54,000 | $5,000 | $49,000 |
| 2022 | $774 | $54,000 | $5,000 | $49,000 |
| 2021 | $523 | $30,000 | $5,000 | $25,000 |
| 2020 | $521 | $30,000 | $5,000 | $25,000 |
| 2019 | $526 | $30,000 | $5,000 | $25,000 |
| 2018 | $536 | $30,000 | $5,000 | $25,000 |
| 2017 | $387 | $20,000 | $6,000 | $14,000 |
| 2015 | $508 | $20,000 | $6,000 | $14,000 |
| 2014 | $408 | $20,000 | $6,000 | $14,000 |
Source: Public Records
Map
Nearby Homes
Your Personal Tour Guide
Ask me questions while you tour the home.