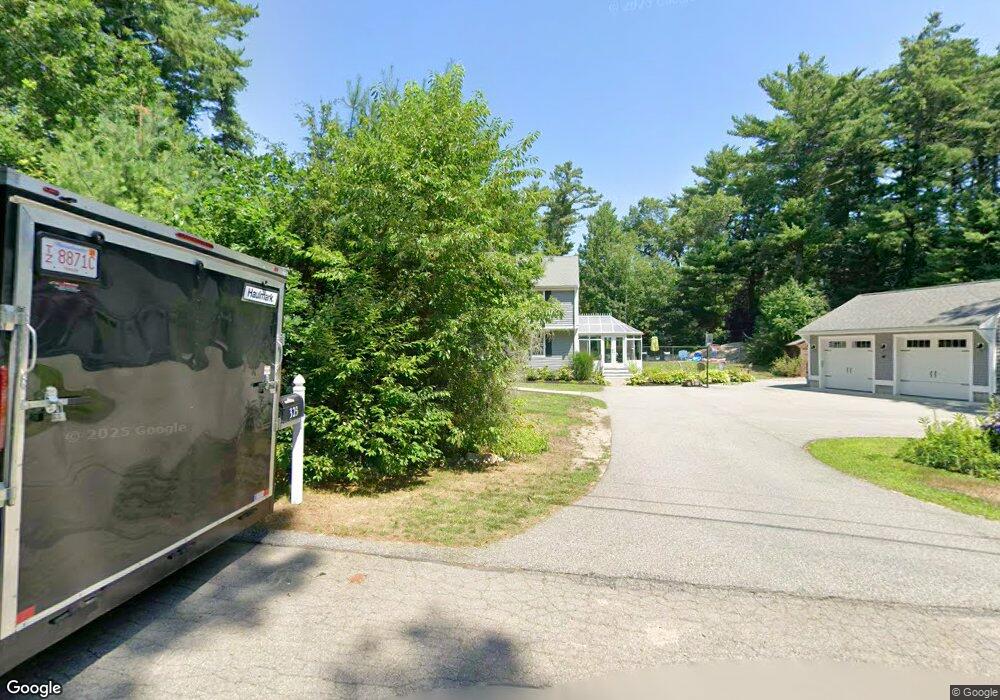
323 Ferry St Marshfield, MA 02050
Estimated Value: $723,000 - $827,000
4
Beds
3
Baths
1,700
Sq Ft
$456/Sq Ft
Est. Value
About This Home
This home is located at 323 Ferry St, Marshfield, MA 02050 and is currently estimated at $774,442, approximately $455 per square foot. 323 Ferry St is a home located in Plymouth County with nearby schools including South River, Furnace Brook Middle School, and Marshfield High School.
Ownership History
Date
Name
Owned For
Owner Type
Purchase Details
Closed on
Apr 27, 2023
Sold by
Haley Jennifer
Bought by
Jennifer Haley Ret
Current Estimated Value
Purchase Details
Closed on
Dec 1, 2017
Sold by
Nee Marilyn S
Bought by
Marilyn S Nee Ret
Purchase Details
Closed on
Jan 24, 1992
Sold by
Nee James J
Bought by
Nee James J and Nee Marilyn S
Create a Home Valuation Report for This Property
The Home Valuation Report is an in-depth analysis detailing your home's value as well as a comparison with similar homes in the area
Home Values in the Area
Average Home Value in this Area
Purchase History
| Date | Buyer | Sale Price | Title Company |
|---|---|---|---|
| Jennifer Haley Ret | -- | None Available | |
| Marilyn S Nee Ret | -- | -- | |
| Nee James J | $33,334 | -- |
Source: Public Records
Mortgage History
| Date | Status | Borrower | Loan Amount |
|---|---|---|---|
| Previous Owner | Nee James J | $100,000 | |
| Previous Owner | Nee James J | $85,000 | |
| Previous Owner | Nee James J | $75,000 |
Source: Public Records
Tax History Compared to Growth
Tax History
| Year | Tax Paid | Tax Assessment Tax Assessment Total Assessment is a certain percentage of the fair market value that is determined by local assessors to be the total taxable value of land and additions on the property. | Land | Improvement |
|---|---|---|---|---|
| 2025 | $6,256 | $631,900 | $324,700 | $307,200 |
| 2024 | $6,137 | $590,700 | $309,400 | $281,300 |
| 2023 | $6,046 | $534,100 | $287,200 | $246,900 |
| 2022 | $5,776 | $446,000 | $232,500 | $213,500 |
| 2021 | $5,612 | $425,500 | $230,300 | $195,200 |
| 2020 | $5,349 | $401,300 | $210,700 | $190,600 |
| 2019 | $5,206 | $389,100 | $210,700 | $178,400 |
| 2018 | $5,161 | $386,000 | $210,700 | $175,300 |
| 2017 | $5,028 | $366,500 | $199,800 | $166,700 |
| 2016 | $4,805 | $346,200 | $188,900 | $157,300 |
| 2015 | $4,560 | $343,100 | $188,900 | $154,200 |
| 2014 | $4,341 | $326,600 | $173,700 | $152,900 |
Source: Public Records
Map
Nearby Homes
- 480 Ferry St
- 39 High Beacon Way
- 235 Main St
- 341 Furnace St
- 566 Holly Rd
- 8 Duxbury St
- 311 S River St
- 92 Salt Meadow Waye
- 167 Planting Field Rd
- 1155 Main St
- 2 Proprietors Dr Unit 23
- 3 Summer St
- 4 Summer St
- 120 Holly Rd
- 14 Red Pony Path
- 255 Ridge Rd
- 74 Elm St
- 287 Summer St
- 5 Maple Ln Unit 5
- 30 Chandler Dr
- 321 Ferry St
- 10 Blanchard Rd
- 142 California St
- 299 Ferry St
- 323 Blanchard Dr
- 333 Ferry St
- 327 Ferry St
- 317 Ferry St
- 337 Ferry St
- 289 Ferry St
- 120 California St
- Lot 4 Monica Way
- Lot 10 Adelaide Way
- 0-Lot 2 Monica Way
- Lot 12 Adelaide Way
- Lot 3 Adelaide Way
- 25 Ewell Way Off Pilgrim Rd
- L3 Adelaide Way
- 296 Ferry St
- 343 Ferry St