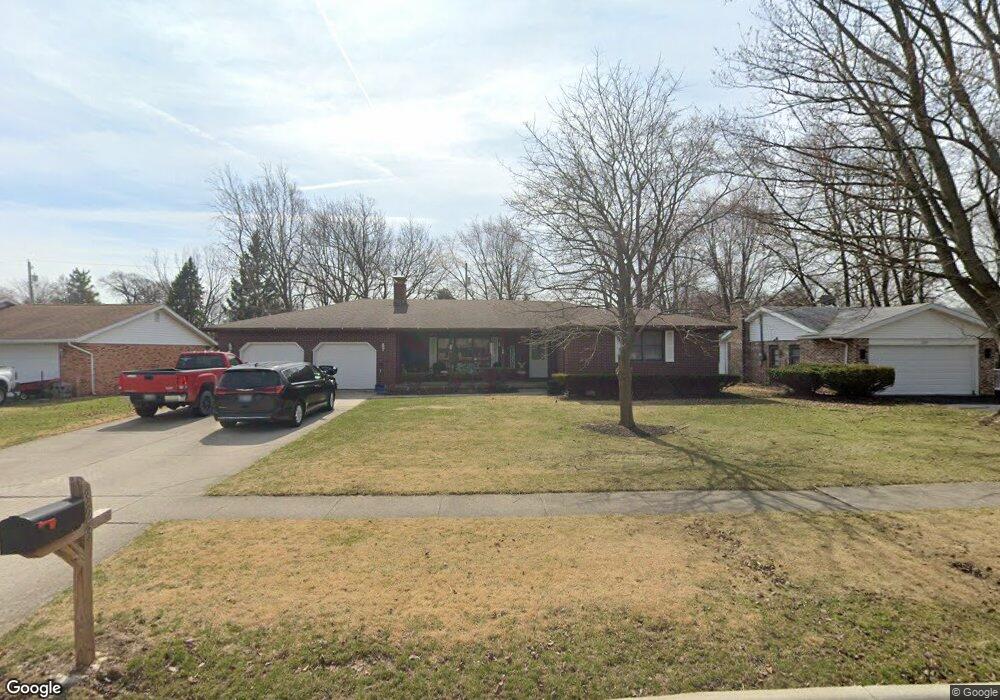
323 Hillshafer Dr Findlay, OH 45840
Estimated Value: $251,000 - $261,947
3
Beds
3
Baths
1,625
Sq Ft
$158/Sq Ft
Est. Value
About This Home
This home is located at 323 Hillshafer Dr, Findlay, OH 45840 and is currently estimated at $256,237, approximately $157 per square foot. 323 Hillshafer Dr is a home located in Hancock County with nearby schools including Bigelow Hill Elementary School, Northview Elementary School, and Glenwood Middle School.
Ownership History
Date
Name
Owned For
Owner Type
Purchase Details
Closed on
Sep 18, 2012
Sold by
Insley Thomas L
Bought by
Daugherty Rick A
Current Estimated Value
Purchase Details
Closed on
Aug 27, 2012
Sold by
Insley Thomas L and Insley Kathleen
Bought by
Daugherty Ricky A
Purchase Details
Closed on
Apr 19, 2012
Sold by
Estate Of Evelyn G Insley
Bought by
Insley Thomas L and Fornof Carol Ann
Purchase Details
Closed on
Jun 20, 2003
Sold by
Estate Of Raymond R Insley
Bought by
Insley Evelyn G and Raymond R Insley Trust
Purchase Details
Closed on
May 1, 1996
Sold by
York Donald
Bought by
Insley Raymond and Insley Evelyn
Purchase Details
Closed on
Mar 1, 1993
Bought by
York Donald E and York Lori A
Purchase Details
Closed on
Jul 22, 1986
Bought by
Miller Carl E and Miller Kathleen M
Purchase Details
Closed on
Mar 20, 1986
Bought by
Grundy Rodney E and Grundy Alma R
Purchase Details
Closed on
Nov 8, 1982
Bought by
Coppes Timothy J and Coppes Kathy K
Create a Home Valuation Report for This Property
The Home Valuation Report is an in-depth analysis detailing your home's value as well as a comparison with similar homes in the area
Home Values in the Area
Average Home Value in this Area
Purchase History
| Date | Buyer | Sale Price | Title Company |
|---|---|---|---|
| Daugherty Rick A | $55,000 | Assured Title | |
| Daugherty Ricky A | $55,000 | Assured Title | |
| Insley Thomas L | -- | None Available | |
| Insley Evelyn G | -- | -- | |
| Insley Raymond | $127,500 | -- | |
| York Donald E | $106,000 | -- | |
| Miller Carl E | $80,000 | -- | |
| Grundy Rodney E | $78,500 | -- | |
| Coppes Timothy J | $9,800 | -- |
Source: Public Records
Tax History Compared to Growth
Tax History
| Year | Tax Paid | Tax Assessment Tax Assessment Total Assessment is a certain percentage of the fair market value that is determined by local assessors to be the total taxable value of land and additions on the property. | Land | Improvement |
|---|---|---|---|---|
| 2024 | $2,333 | $64,000 | $9,970 | $54,030 |
| 2023 | $2,337 | $64,000 | $9,970 | $54,030 |
| 2022 | $2,329 | $64,000 | $9,970 | $54,030 |
| 2021 | $2,309 | $55,280 | $9,580 | $45,700 |
| 2020 | $2,309 | $55,280 | $9,580 | $45,700 |
| 2019 | $2,263 | $55,280 | $9,580 | $45,700 |
| 2018 | $2,145 | $48,070 | $8,330 | $39,740 |
| 2017 | $1,073 | $48,070 | $8,330 | $39,740 |
| 2016 | $2,119 | $48,070 | $8,330 | $39,740 |
| 2015 | $2,412 | $53,630 | $10,120 | $43,510 |
| 2014 | $2,412 | $53,630 | $10,120 | $43,510 |
| 2012 | $2,428 | $53,630 | $10,120 | $43,510 |
Source: Public Records
Map
Nearby Homes
- 3300 Crosshill Dr
- 615 Hillcrest Ave
- 506 Hillcrest Ave
- 3239 N Main St
- 126 Hillcrest Ave
- 3315 Terrace Ln
- 0 Township Highway 99
- 12325 Township Highway 99
- 1310 Muirfield Dr
- 0 County Road 220 Unit 6111396
- 0 County Road 220 Unit 6111394
- 0 County Road 220 Unit 6111400
- 128 Harrington Ave
- 0 Allen Township 142
- 231 Tioga Ave
- 933 Laurel Ln
- 3018 Gleneagle Dr
- 3106 Saddlebrook
- 1405 Cypress Lake
- 643 Edith Ave
- 315 Hillshafer Dr
- 333 Hillshafer Dr
- 307 Hillshafer Dr
- 339 Hillshafer Dr
- 3307 Norcrest St
- 3338 Ridgeview Dr
- 3332 Ridgeview Dr
- 316 Hillshafer Dr
- 324 Hillshafer Dr
- 3315 Norcrest St
- 301 Hillshafer Dr
- 332 Hillshafer Dr
- 308 Hillshafer Dr
- 3326 Ridgeview Dr
- 340 Hillshafer Dr
- 401 Hillshafer Dr
- 300 Hillshafer Dr
- 3337 Ridgeview Dr
- 241 Hillshafer Dr
- 400 Hillshafer Dr